Cross Cultural Design Research
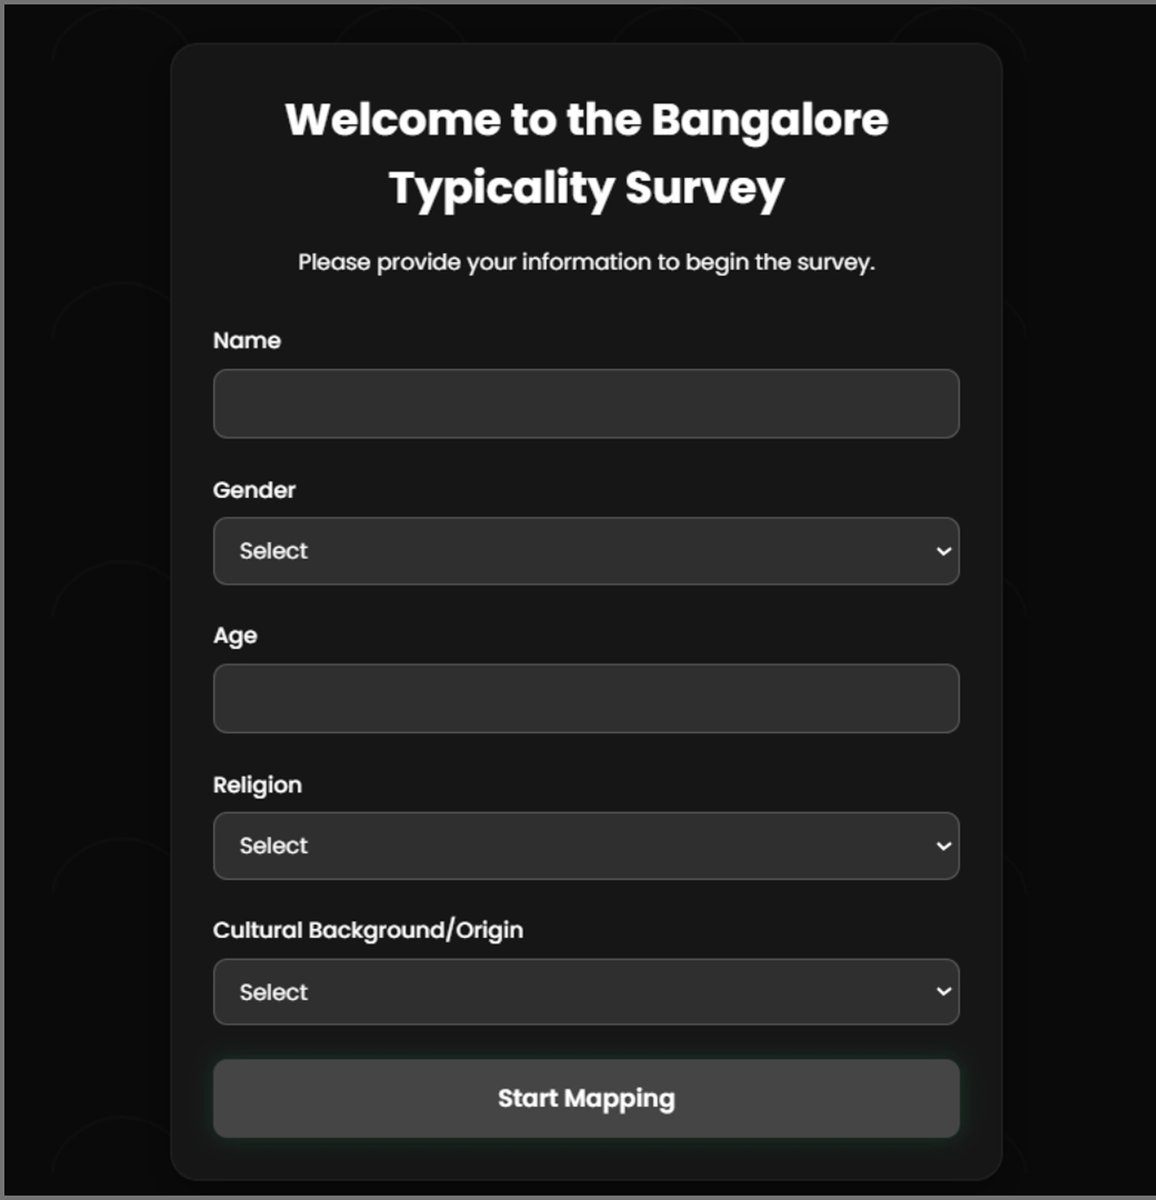
This research investigates the multifaceted construction of cultural identities within two distinct contexts: The study examines the participatory research experiment on how migrants in Bangalore interpret "Bengaluru-ness".
How migrants in Bangalore perceive "Bengaluru-ness" through a triangulated framework of semantics, semiotics and typicality mapping.
Plato's Allegory of the Cave
Drawing inspiration from Plato's Allegory of Cave, I chose to explore how domestic migrants perceive 'Bengaluru-ness' because I wanted to understand if our experience of the city is only a fragmented shadow of its reality - a shadow shaped by assumptions, stereotypes and cultural biases. As someone navigating both identities - a North Indian adapting to a South Indian city - I felt like I was constantly shifting between Bangalore, the metropolitan illusion and Bengaluru, the authentic, nuanced experience of the locals. The study highlights the importance of examining cultural phenomena through methodologies that illuminate both shared experiences and variations in perception and construction of cultural identities.
Triangulated Framework
A triangulated framework combining semantics, semiotics and typicality mapping was employed to capture the ways participants assign meaning to symbols, language and imagery. Semantics provided insights into how key words and phrases take on specific meanings depending on the context, semiotics explored the cultural codes within visual and symbolic representations. Typicality mapping classified perceptions from typical to atypical, highlighting similarities and differences across participant backgrounds.
This study applies the above triangulated framework to the case studies which differ in their approaches: one emic and the other etic. It also demonstrates how this method can be used to obtain both qualitative and quantitative data, explore biases and broaden our understanding of cultural identity formation.
This approach can guide future cross-cultural research, providing a replicable model for studying complex social and cultural patterns in an increasingly interconnected world.
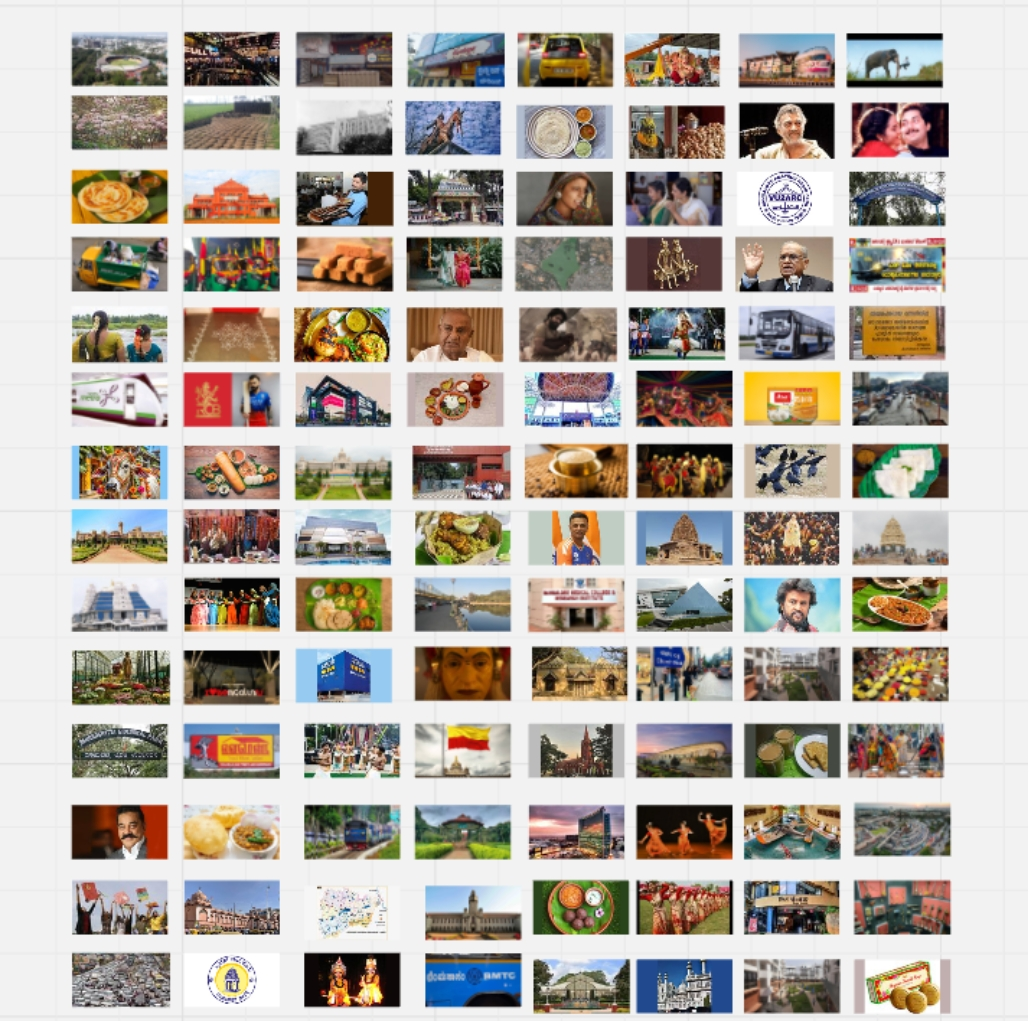
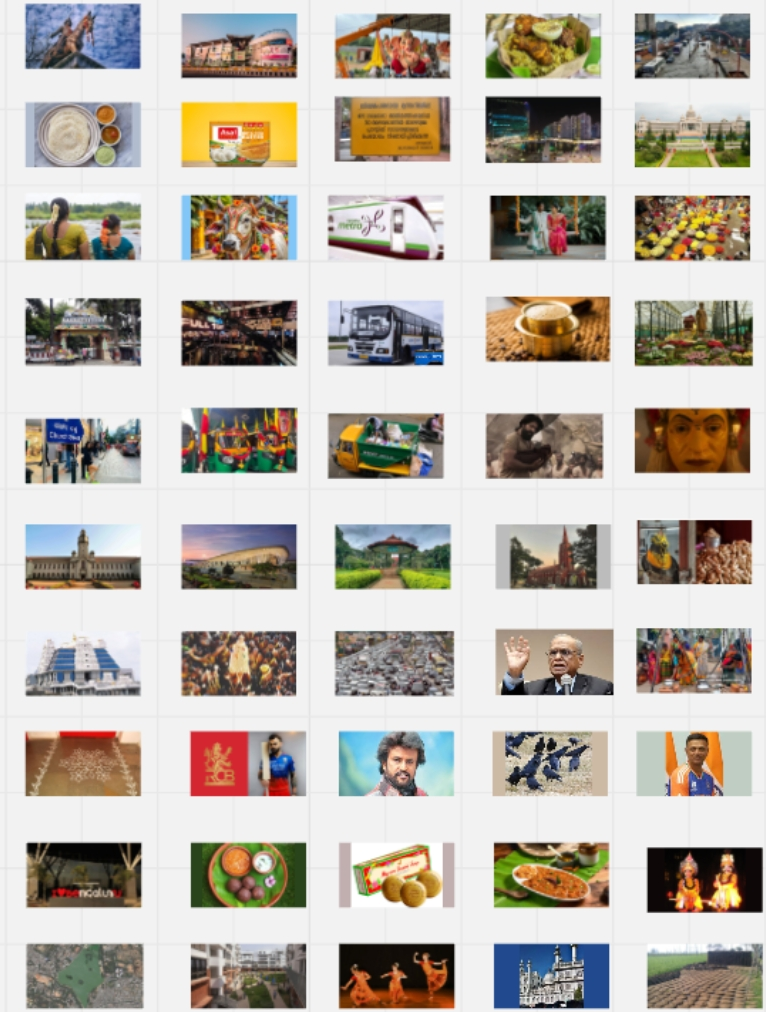
From 112 to 50 Images
I started out with a deck of 112 images and made a Drag and Drop Game in JavaScript. Although the game was interesting for some people, others got fatigued in the middle of it. According to them the fatigue was an outcome of processing a large number of images. They started sorting images randomly after a point.
The other limitation of the game was that it did not provide space for side-to-side comparison of the sorted images which became a barrier in elaborate discussions from the perspective of Semantics and Semiotics.
Hence, I decided to shift to a more open method for Card Sorting. I also reduced the number of images to 50 for offsetting the fatigue factor. My first preference was doing the activity with physical cards as it provides a tactile experience which is more engaging but due to lack of availability of participants offline, I decided to conduct the activity on a Collaboration software called Miro.
This method allowed for more open and diverse discussions, active engagement of participants and better side-to-side comparisons of images.
Semantics & Semiotics on Miro
Online Card Sorting was utilized as a tool to carry out semantics and semiotics on Miro. The participants could annotate images, create groupings, and engage in meaning making through collaborative discussion. This method bridged the gap between quantitative sorting data and rich qualitative insights.
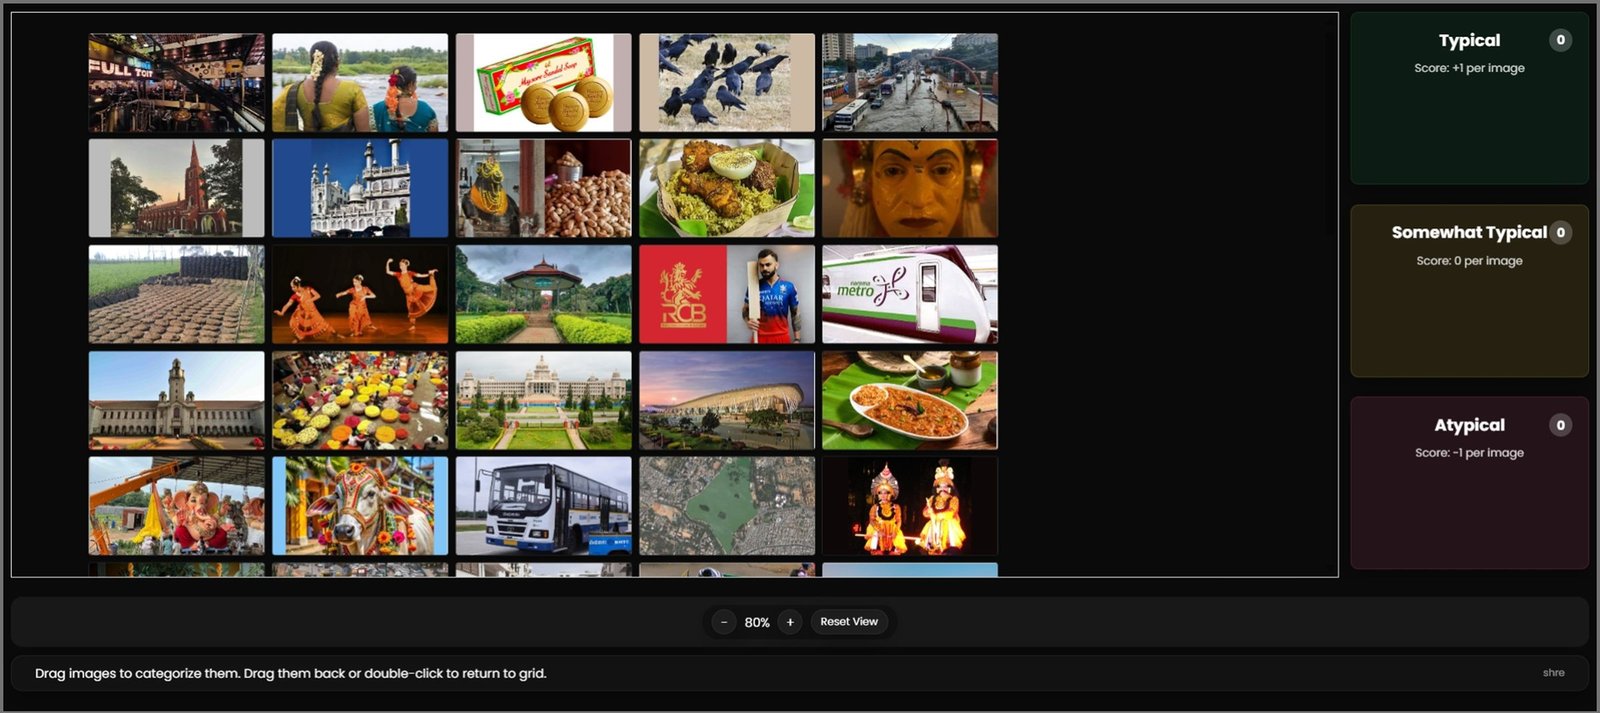
The Typicality Scale
Average score assigned to each image, sorted by demographics. Scale ranges from -0.833 (most Atypical) to 0.917 (most Typical).
Scroll to explore the full scale
Key Findings
This research was carried out with 16 participants initially but due to the paucity of time, I could only process the data of 12 participants. Out of the 12 participants, 5 were males and 7 were females. Majority of participants were natives of North/Central India. The insights obtained are as following:
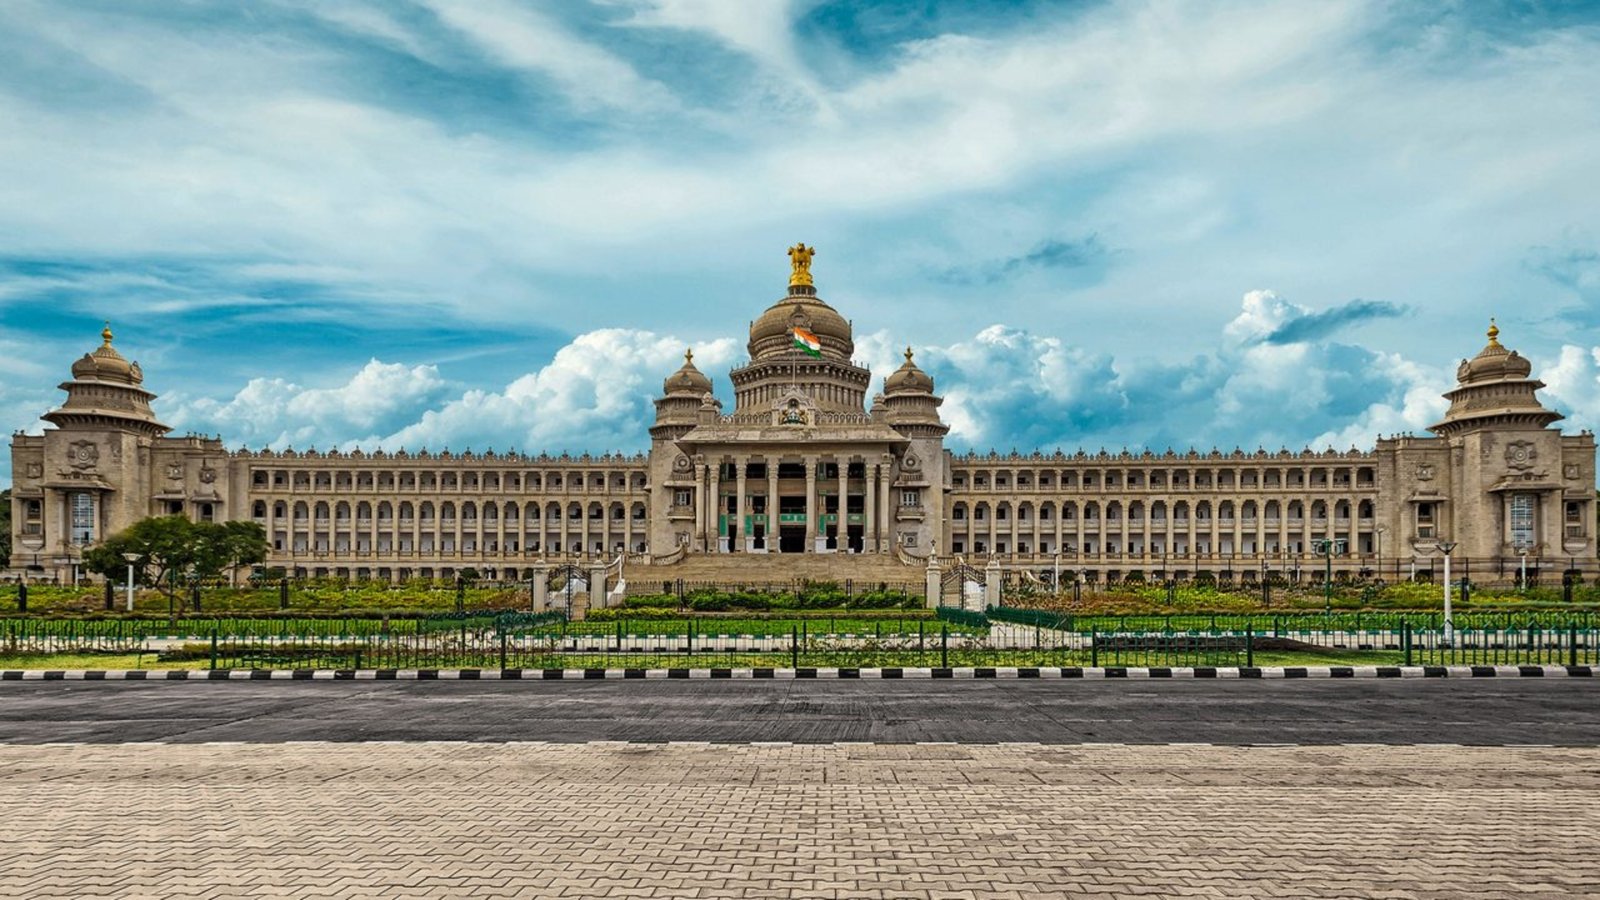
BMTC Bus and Vidhan Soudha got the highest average typicality for Bengaluru-ness from all participants.
Bharat Natyam, Forum Mall and Groundnut Festival got the average typicality score of 0.
Cow dung cake turned out to be the most Atypical image of all.
However, there were differences on how the two genders perceived Bengaluru-ness.
Gender, Age, exposure and profession based differences were also found in the research.
People associated Bengaluru-ness more with the architecture and Botanical Gardens than the native food and festivals.
Although Bangalore is the anglicized phonetic adaptation of the Kannada name - Bengaluru, which got a name change in 2005, many people were not aware of the fact and only a few people were able to distinguish Bengaluru-ness from Bangalore-ness by connecting back to this fact.
People also had pre-conceived notion that Bengaluru is all developed and there are no rural/peri-urban spaces.
One interesting observation was that most of the migrant people talked about how they have spotted very few crows in Bengaluru.
In Their Words
"I have not seen crows in BLR. Cow dung cakes would be somewhere around the rural areas but never seen crows."
"This looks like a temple - looks like ISCON temple but could be a masjid - BLR does not have many muslims - so such a big Mosque does not make sense."
"This hero looks Tamil - He has long hair and dense mustache & beard - looks like a villain."
"This is Pongal - I have not seen people celebrate it but have seen such images in Rangolis."
"I know that this is a south Indian Language but of which city, I have no clue."
"South India has lots of churches but not sure whether this particular church is located in BLR."
"Looks like North India. Never seen Cow Dung cakes in BLR."
"Bharatnatyam is a south Indian thing - not particularly of BLR."
"Malls are there in all the major cities - since BLR is a city."
"Looks like a newly married south-Indian Couple but not unique to BLR."
"I have also seen such decorated cows in Hyd - Bhikshu Cows."
"Some south Indian ceremony by the look of the bull and groundnut is given as prasadam I guess."
Reflective Notes
The reflective notes document captures the researcher's ongoing observations, methodological decisions, and analytical reflections throughout the card sorting and typicality mapping process.
This case study documents participatory research on how domestic migrants in Bangalore perceive "Bengaluru-ness" through a triangulated framework combining semantics, semiotics, and typicality mapping. The research was conducted with 12 participants (5 male, 7 female) using a 50-image card sorting methodology on Miro.
