Designing a Full-Stack Investment Decision Tool for a Private Family Office
I worked with a small team of developers and researchers to build a system that scans stocks in real time, scores them against defined parameters, places buy and sell orders, and automatically manages trailing stop-losses, all inside a spreadsheet the investment team already knew how to use.
The Brief
I was brought on to design and research for a private family office that manages a concentrated equity portfolio. They had a clear problem: their workflow (a patchwork of broker terminals, Telegram groups, and personal spreadsheets) couldn't keep up with how they actually wanted to trade. They needed a tool that could do three things:
- Scan, rate, and act. Scan stocks listed on NSE and BSE against technical parameters (consolidation patterns, volume breakouts, RSI momentum), score them on a 0–100 scale, generate daily picks across three timeframes (intraday, swing/BTST, positional), and let them buy directly from the same screen.
- Watch the news. Pull every corporate action, board meeting, financial result, and shareholding change from NSE and BSE exchange feeds, classify each one for investment relevance, and surface the ones that matter before the market prices them in.
- Protect capital without babysitting. Once a position is open, manage risk with trailing stop-losses that adjust in real time as prices move, and automatically place the sell order when the stop triggers.
The team was small (two principals and one analyst) and they had zero interest in learning a new application. They already lived in spreadsheets. Whatever I designed had to meet them where they were.
Understanding the Decision Process
Before I designed anything, I sat with the principals during market hours for two full weeks. Not to interview them, but to watch. I wanted to map the decision chain: what information triggers a trade idea, what parameters confirm it, what makes them pull the trigger, and what makes them exit.
The Existing Workflow (Before)
Every morning at 8:45 AM, the analyst would open four browser tabs: Shoonya (the broker), Chartink (for technical scans), NSE and BSE announcement pages, and a Google Sheet tracking open positions. He'd run 3–4 pre-set scans on Chartink, copy promising tickers into the sheet, manually check RSI and volume on TradingView, and flag candidates for the principals.
- The scan-to-decision loop took 25–40 minutes, an eternity when the market opens at 9:15.
- Stop-losses were static, set once at entry and never adjusted. Profits that existed on screen disappeared because no one was watching at the right moment.
- Corporate actions were checked once a day, in the evening. Time-sensitive announcements were sometimes caught a full day late.
- Nobody tracked true trading costs. "Zero brokerage" on Shoonya masked real costs of 0.10–0.15% per round trip in statutory charges.
The Principal
Decision maker. Manages capital allocation. Trades 3–5 times per week across intraday, BTST, and weekly positions. Wants scored picks with clear risk-reward ratios, not raw screener output. Checks the screen 6–8 times during market hours, each glance under 90 seconds.
- Wants pre-scored picks he can act on immediately
- Needs one-glance P&L with all charges included
- Expects trailing stops to sell automatically, no babysitting
- Trusts parameters over gut feeling
The Analyst
Configures scan parameters, monitors corporate actions, adjusts stop-loss levels. Comfortable with formulas and technical indicators. Currently spends 2+ hours daily on manual data gathering that could be automated.
- Needs configurable scan criteria (RSI range, volume, period)
- Wants news classified by relevance, not a raw feed
- Needs to see which stops are active and where they sit
- Uses the spreadsheet for ad-hoc analysis alongside everything else
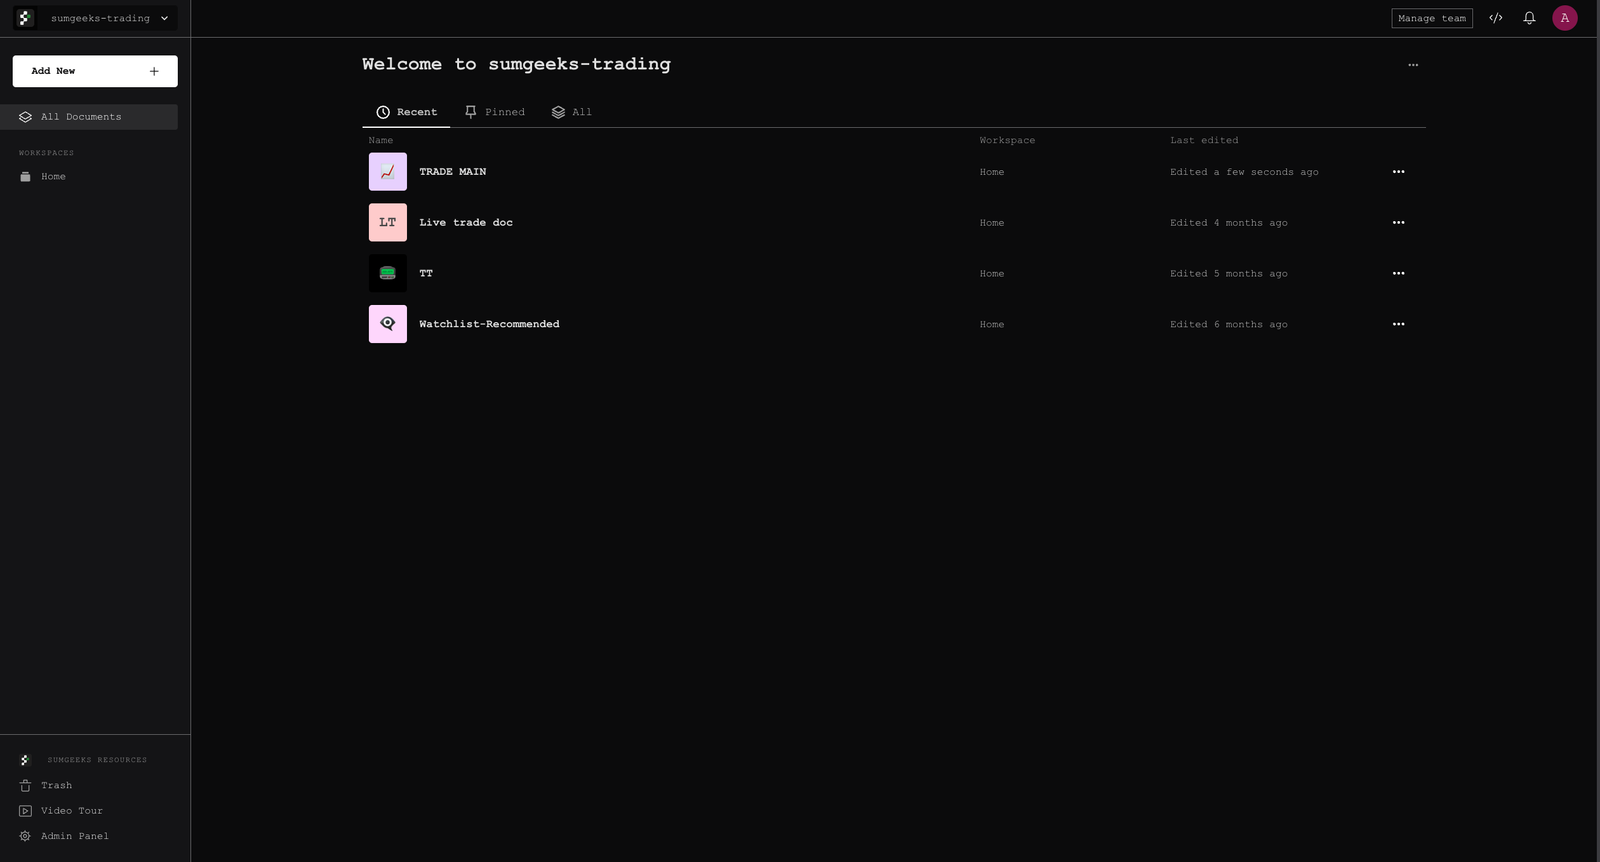
An Investment Terminal Inside a Spreadsheet
Working with the development team, I decided to build the system on Grist, an open-source spreadsheet platform, for one reason: the team already thought in rows and formulas. Rather than make them learn a new app, we embedded five custom widgets directly into their existing spreadsheet. Each widget sits in a panel in the Grist layout (resizable, rearrangeable, linked to the same data tables) and draws from a shared real-time data feed underneath. The system doesn't just show data. It scans, scores, buys, sells, and manages stops, all from within the spreadsheet.
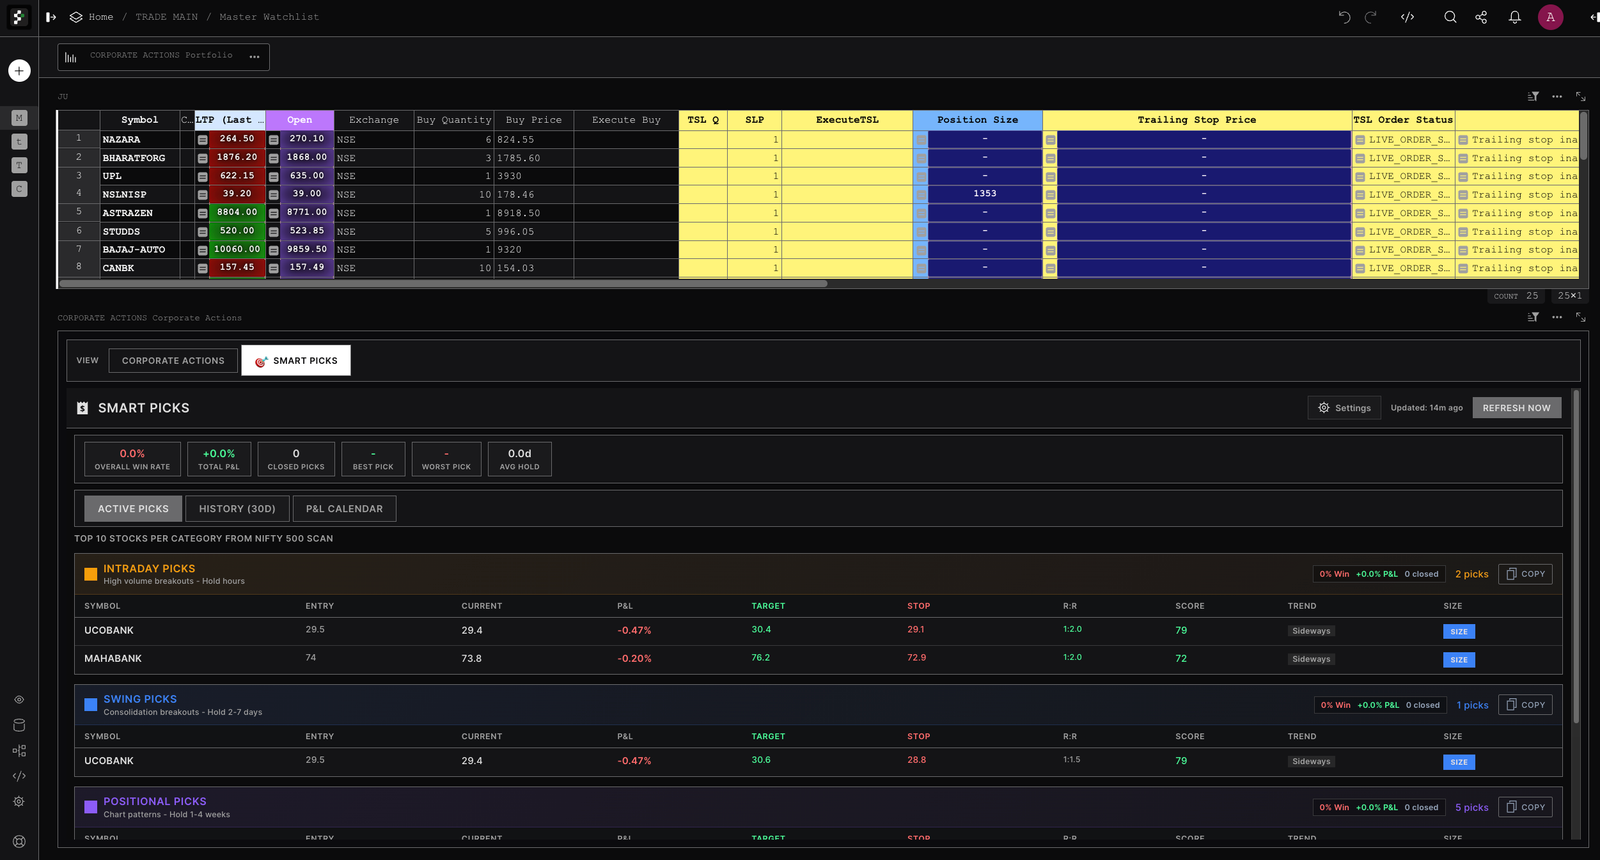
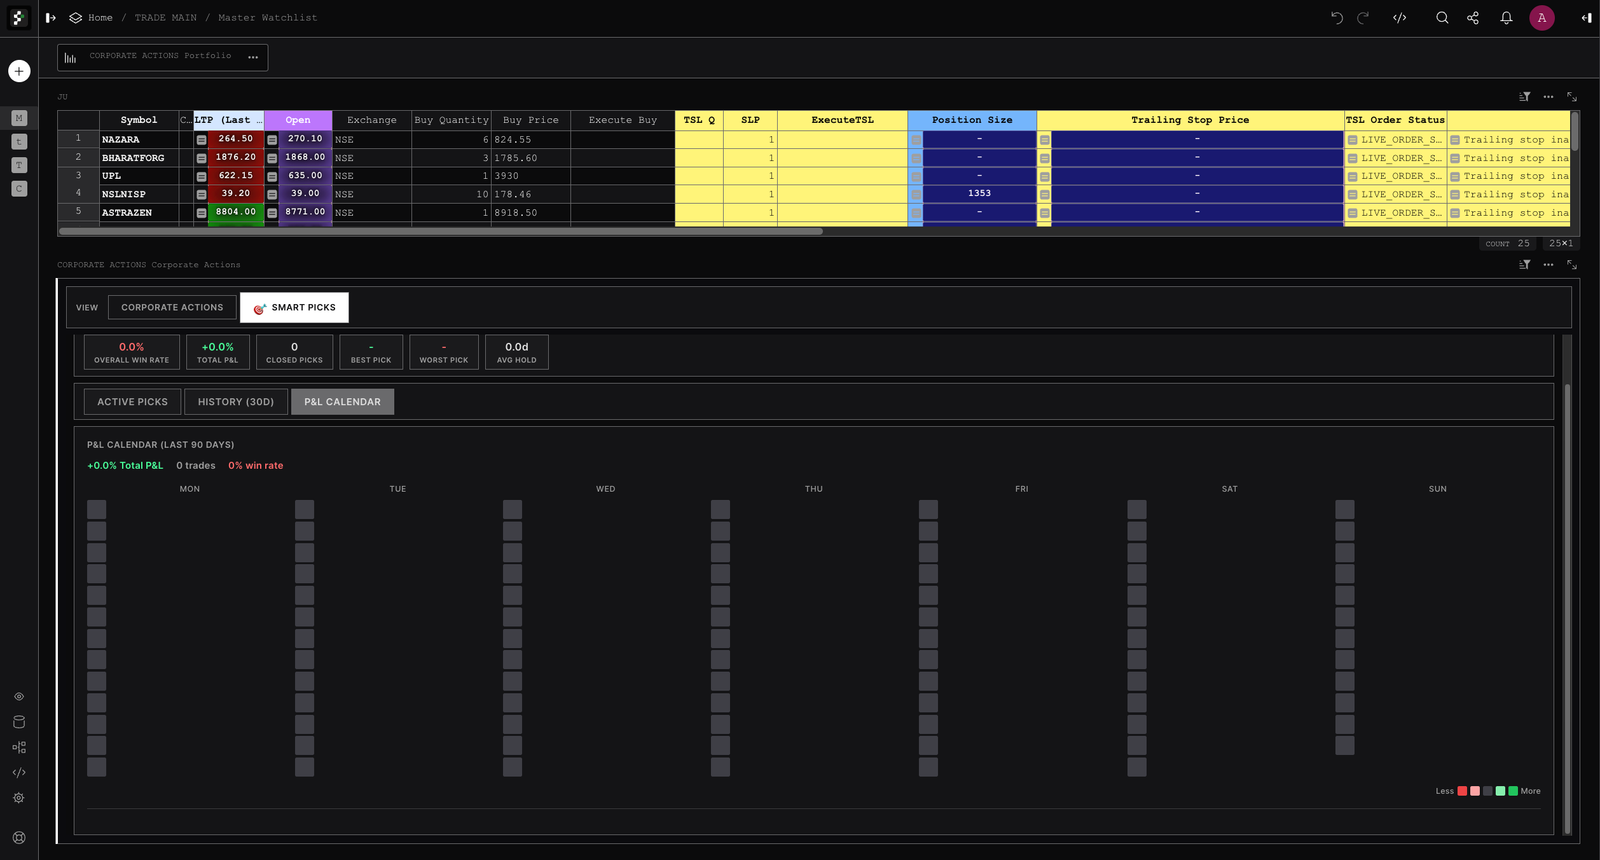
SmartPicks: Scored Picks That Replaced the Morning Scan
SmartPicks is the centrepiece, the feature that killed the analyst's morning routine of running manual scans, copying tickers into a sheet, and checking indicators one by one.
Every 15 minutes during market hours, the system runs a technical scan against the configured index (Nifty 50, 100, or 500), scores each stock on five weighted parameters, and shows the top 10 as picks you can act on, with entry price, target, stop-loss, and risk-reward ratio already calculated. The principal can buy directly from the picks list.
Three Timeframes, Three Strategies
Breakout + High Volume
Hold: hours. Clear by 3 PM IST. For momentum plays that need to work fast or not at all.
Volume floor: 3x average | R:R minimum: 2.5:1
Consolidation Breakout
Hold: 2–7 days. For stocks breaking out of multi-day consolidation zones with volume confirmation.
Auto-expire: 7 days | R:R minimum: 2:1
Chart Pattern + Trend
Hold: 1–4 weeks. For established trends confirmed by chart patterns and strong moving averages.
Auto-expire: 30 days | R:R minimum: 1.5:1
The Scoring Model (0–100)
Each stock that passes the initial filters gets a score out of 100. We calibrated the weights over three months of paper trading and adjusted them twice after going live:
| Parameter | Weight | What It Measures | Scoring Logic |
|---|---|---|---|
| Volume | 25–30% | Confirmation of breakout conviction | ≥2x = pass, 3x+ = bonus. Below 2x = rejected. |
| Trend | 25–30% | Direction and strength of the move | "Strong Up" = full marks. "Up" = 80%. Flat/Down = disqualified. |
| RSI | 20% | Momentum without overextension | Sweet spot: 50–70. Below 45 or above 85 = hard reject. |
| Breakout Distance | 15% | How far price has moved from breakout level | <3% (intraday), <4% (swing), <6% (positional). Beyond = "already moved." |
| MA Signal | 15% | Moving average confirmation | Bullish MA cross = full marks. Support = partial. Bearish = reject. |
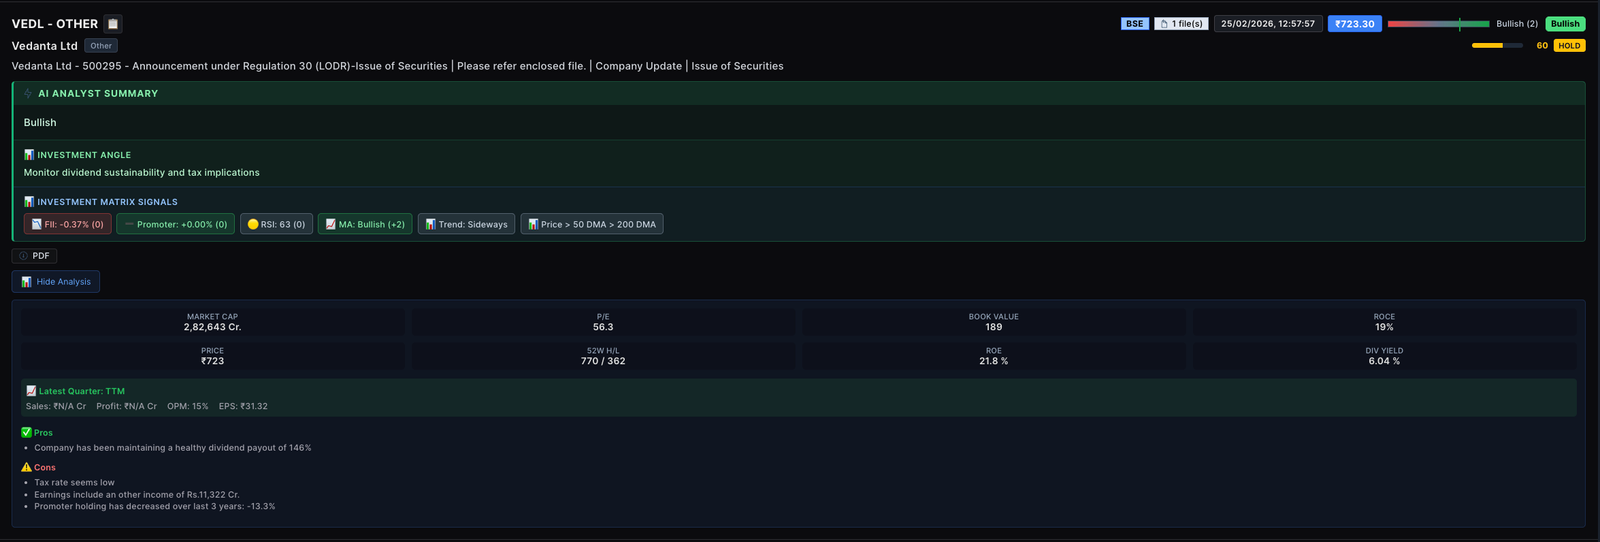
Corporate Actions: Turning Exchange Noise into Something Useful
NSE and BSE publish RSS feeds for announcements, corporate actions, board meetings, financial results, and shareholding patterns. Across both exchanges, that's thousands of items, too many for three people. But buried in the noise are time-sensitive items: a buyback announcement, a promoter quietly increasing their stake, a dividend declaration that hints at strong cash flow.
| Output Field | Type | Purpose |
|---|---|---|
| Score | -5 to +5 | How much this matters, directionally |
| Label | Bullish / Bearish / Neutral | Quick glance classification |
| Confidence | 0.0 – 1.0 | How sure the model is. Low scores get flagged for human review |
| Summary | One sentence | Plain-English takeaway readable in 3 seconds |
| Investment Angle | One sentence | What to watch for, or what to do about it |
| Signals Used | List | Which data points drove the conclusion |
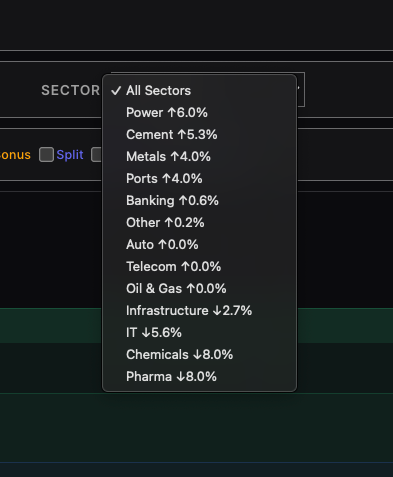
How the Sector Filter Works
The dropdown aggregates sentiment scores from all corporate actions in each sector over the selected timeframe. Upward-trending sectors appear at the top with green arrows; declining sectors sort to the bottom with red. This lets the analyst answer: "which sectors have the most bullish corporate announcements right now?"
Trailing Stop-Loss: A Safety Net That Actually Works
This was the feature the principals asked about most. The problem wasn't that they didn't use stop-losses. It was that static stops don't protect profits. A stock runs up 8%, then pulls back and hits your original stop at -2%. You had a winning trade and still booked a loss.
A trailing stop fixes both problems. It moves up with the price, locking in gains as they happen, and when the price pulls back past the trailing level, the system automatically places the sell order through the broker. No one needs to be watching.
=TRAILING_STOP_LOSS($Symbol, 2.5, $ExecuteTSL, $Exchange)
That's it. $Symbol is the stock, 2.5 is the stop percentage (2.5% below peak), $ExecuteTSL is a checkbox column that arms it, and $Exchange picks NSE or BSE.
Making Every Rupee Visible
The portfolio widget ties everything together. It answers: where does the money stand, right now, after all costs?
"Zero brokerage" is a marketing claim, not a financial reality. On Shoonya, CNC (delivery) brokerage is indeed zero. But every trade still incurs six statutory charges:
| Charge | Rate | Applied To | On ₹1L Buy + ₹1.02L Sell |
|---|---|---|---|
| STT | 0.1% | Buy & sell | ₹202.00 |
| Exchange Txn | 0.00297% | Buy & sell | ₹6.00 |
| SEBI Fees | 0.0001% | Buy & sell | ₹0.20 |
| GST | 18% | On brokerage + exchange + SEBI | ₹1.12 |
| Stamp Duty | 0.015% | Buy-side only | ₹15.00 |
| DP Charges | ₹9 + GST per scrip | Sell-side | ₹10.62 |
| Total real cost of a "zero brokerage" trade | ₹234.94 | ||
Smart Columns: Type a Formula, Get Live Data
The formula system made the spreadsheet foundation genuinely powerful. The moment you enter a formula like =LIVE_PRICE($Symbol, $Exchange) into a column, the system immediately starts overlaying real-time data from Redis into that cell. No delay, no save-and-refresh. The formula tells the system what data to stream, and the overlay engine pushes it to the cell in sub-100 milliseconds.
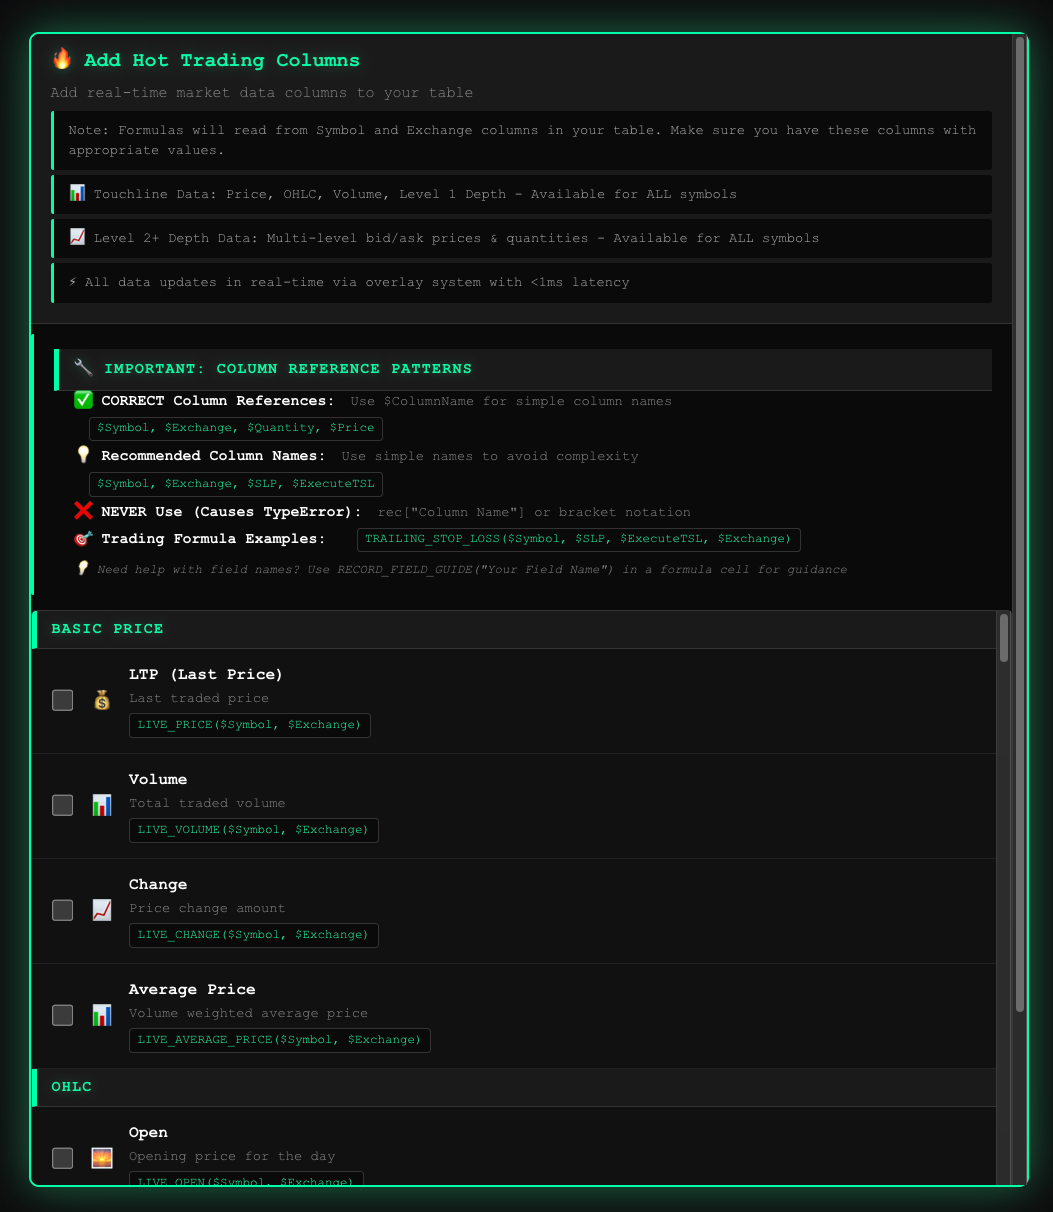
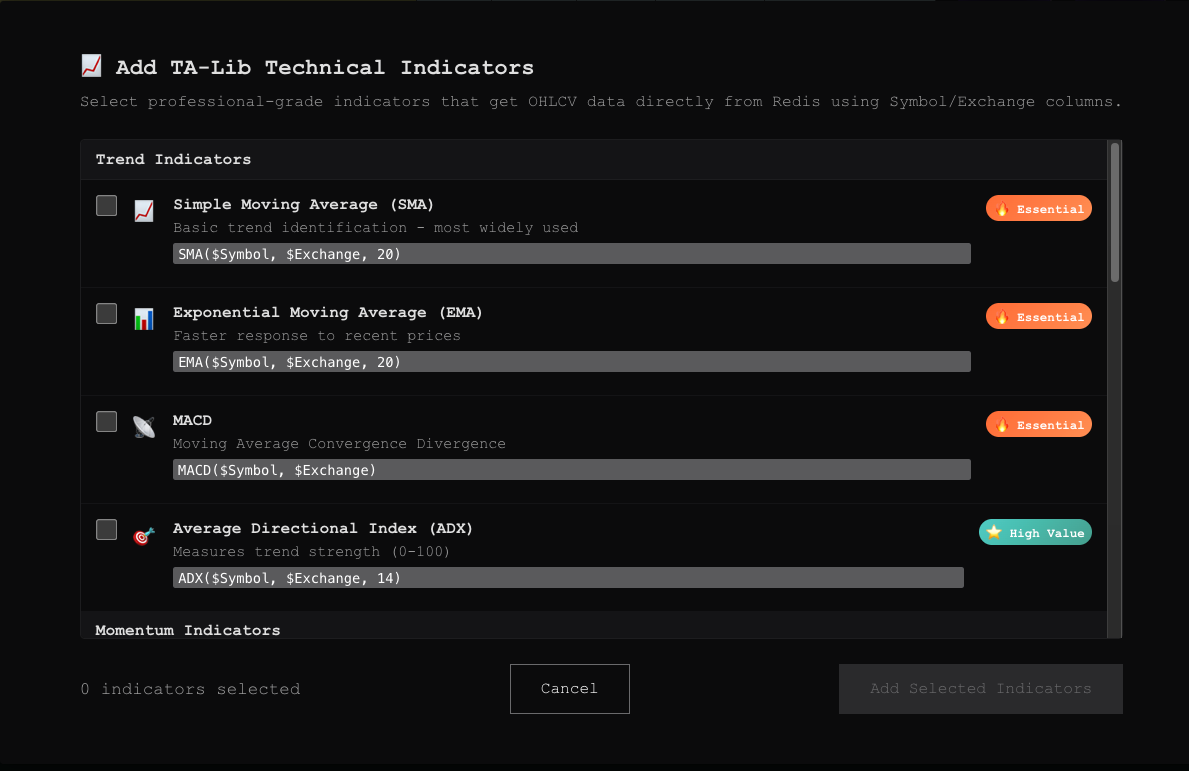
=RSI($Symbol, $Exchange, 14). Instantly, every row shows the live 14-period RSI, pulled from Redis. If the analyst later changes the period to 21, the overlay recalculates immediately. No page reload, no waiting.
The Overlay System: Real-Time Without the Cost
Everything described above (live prices, trailing stop levels, order status, P&L numbers ticking up and down) depends on one technical trick: never write live data to the document.
Grist stores data in SQLite. When a formula result changes, it triggers a recalculate → write → push cycle that takes about 300ms. For a portfolio with 30 symbols updating 10 times per second, that's not possible.
The solution: the system injects HTML overlays directly on top of formula cells. The formula =LIVE_PRICE("RELIANCE") stores the last-saved price. The overlay, a positioned element matched to the cell's coordinates, shows the real-time price from the WebSocket feed. Price ticks flow through Redis to a caching layer, then to the browser in sub-100 milliseconds. No disk writes. No recalculation loop.
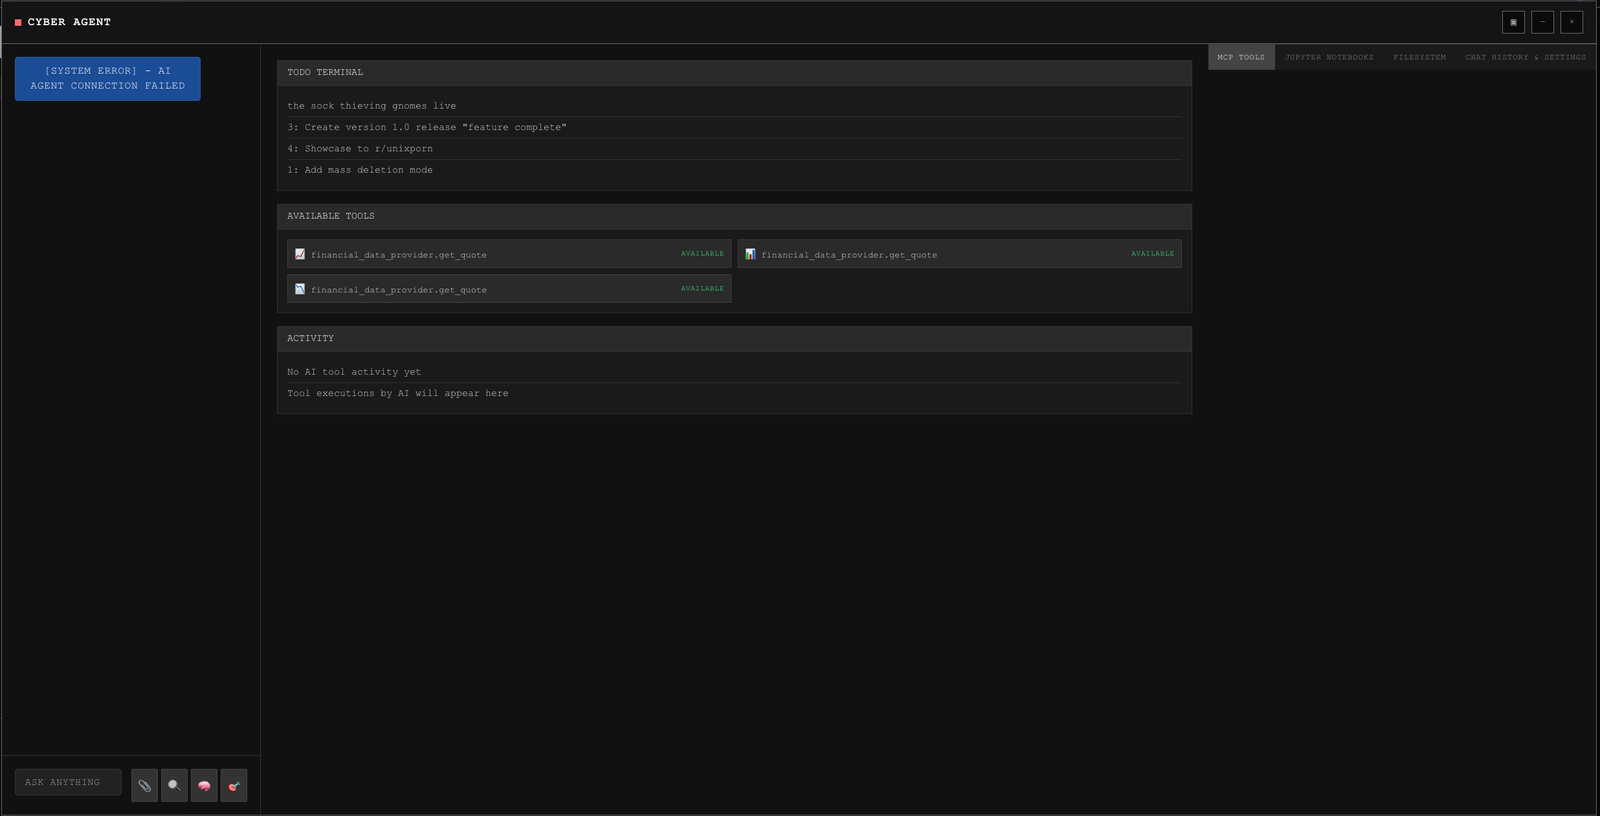
Cyber Agent: Talk to the System in Plain English
Beyond the structured widgets, I designed an interface around a conversational agent we call "Cyber Agent." It runs Claude Code under the hood and has access to financial data tools, so the team can ask it questions in plain English and it'll look up quotes, pull data, or run analysis.
It also has access to a built-in Jupyter notebook. The analyst can ask the agent to pull historical data, run a correlation analysis, plot a chart, or backtest a strategy, and the agent writes and executes the Python code right there in the notebook.
What I Found
The morning workflow went from 35 minutes to under 5
SmartPicks killed the manual scan-copy-check cycle. The analyst opens the document, reviews the picks (already updated from the 9:15 AM scan), flags any with corporate action overlaps, and the principal decides. What used to fill the pre-market hour is now a 5-minute standing item.
Trailing stops protected profits that would have been missed
In the first three months of live use, trailing stops triggered 14 times. Every single one placed the sell order correctly without anyone touching anything. The principal told me this was "the feature that lets me sleep."
Showing real charges cut trade frequency by about 20%
Once the team could see STT and stamp duty ticking up as running costs, they started evaluating marginal trades differently. "Is this trade worth the ₹200 in STT?" became a real question. Fewer trades, same portfolio performance, lower total costs.
System is locked to Indian equities with no multi-market support yet
The entire pipeline (scanning, scoring, broker integration, corporate actions) is built around NSE and BSE. The family office has expressed interest in trading US equities and crypto, but expanding means new data sources, different exchange feeds, separate broker APIs, and a different regulatory layer for charges. The architecture supports it in theory, but every widget assumes Indian market conventions today.
Scoring parameters need a feedback loop, not just calibration
The scoring weights were tuned manually over three months of paper trading, but there's no structured mechanism for the model to learn from its own results. When a parameter consistently underperforms (e.g., MA signal producing false positives in sideways markets), the analyst notices it weeks later by gut feel rather than by the system surfacing it. A proper feedback loop that flags parameter drift automatically would make the scoring model self-correcting over time.
Key Iterations
Ditched the light theme after a 3-hour testing session
White backgrounds were causing noticeable eye strain by the second hour of market watching. Switched to the dark terminal palette. Green/red colors read much better against dark backgrounds.
Merged five separate data connections into one shared channel
Each widget originally had its own price feed, same data, five times the server load. Consolidated into one shared channel that pushes updates to all widgets at once.
Fixed the charges calculation (it was just wrong)
The original 0.03% brokerage figure was incorrect (Shoonya CNC is actually zero) and hid real costs. Replaced it with a breakdown of all seven statutory charges.
Made all widgets look like they belong together
The Corporate Actions widget was built with rounded corners and gradients that stuck out. Flattened it to match the terminal theme: sharp corners, flat backgrounds, same color variables.
What I'd Do Differently
I should have built order entry before the screener. The team's core loop is: see pick → decide → buy. SmartPicks handled "see." The scoring handled "decide." But "buy" was still a formula you had to type out. The gap between seeing a pick and placing the order should be one click.
Charges should have been visible from day one. The team had already built a mental model of "P&L = realized profit" before I added the charges breakdown. Showing the real cost later felt like bad news, even though the money was always being spent.
Paper trading doesn't tell you how the UI feels with real money. There's a difference between a test portfolio dropping ₹2,000 and watching your own money drop ₹2,000. Font sizes, how saturated the red is, where the P&L card sits. Several of these I only got right once real capital was at risk.
Next Steps
- One-click order entry pre-filled from SmartPicks with symbol, quantity, limit price, and stop-loss.
- Risk dashboard sector concentration, drawdown metrics, position correlation.
- Backtesting run the scoring model against historical data to validate parameters.
- Position sizing auto-calculate lot sizes based on a 2% risk-per-trade rule.
This case study documents my design and research work on a private investment decision tool. The system is in active daily use for Indian equity trading (intraday, swing, and positional) with automated order execution and trailing stop-loss management via the Shoonya (Finvasia) broker API. I worked with a team of two developers and one domain researcher over eight months.
Stack: Grist, TypeScript, Python, Redis TimeSeries, Docker, Ollama (Qwen3:30b), Claude Code, Screeni-py, GrainJS.
Hardware: 2x NVIDIA RTX 3090, 62GB system memory.
All wireframes are SVG recreations of actual widget layouts. Screenshots are from the live system.
