Designing a Unified Integration Dashboard for Hospitality Businesses
I designed a SaaS platform that unifies fragmented POS, invoice, and inventory systems into one dashboard for multi-location restaurant and bar operators. The goal was to replace the daily chaos of switching between Toast, vendor invoice portals, spreadsheets, and CRMs with a single source of truth for sales, expenses, and operations data.

A SaaS platform that connects POS systems, automates invoice processing with OCR, and gives multi-location restaurant and bar operators a single dashboard for sales, expenses, and integrations.
The Brief
I was brought on to design a platform for restaurant and bar operators who were drowning in disconnected systems. The problem was clear: a typical multi-location operator juggles between their POS terminal, vendor invoice portals, inventory spreadsheets, CRM tools, and accounting software every single day. No single source of truth existed for their business data. They needed a platform that could do three things:
- Connect everything. Pull sales data from POS systems (Toast, GiveX, Oracle Micros), invoices from vendors (SAQ, Breakthru Beverages), and customer data from CRMs (Salesforce) into one unified dashboard.
- Automate invoice processing. Use OCR to extract line items, taxes, discounts, and vendor details from PDF invoices automatically, eliminating hours of manual data entry per week.
- Scale across locations. Let operators manage multiple restaurant and bar locations from one account, with location-specific billing, access controls, and configuration.
The target users ranged from single-location bar owners to multi-unit restaurant groups with 10+ locations. Whatever I designed had to be simple enough for a bar manager yet powerful enough for a regional operations director.
Understanding the Operator's Day
Before designing anything, I spent two weeks shadowing restaurant managers and bar operators during their daily routines. I sat behind the bar during a Friday night rush, watched a manager reconcile invoices on a Monday morning, and observed how a regional director reviewed weekly numbers across six locations.
The Existing Workflow (Before)
A typical morning for an operations manager looked like this: open Toast POS to check yesterday's sales, log into the SAQ portal to download new invoices, open a shared Google Sheet to manually enter invoice line items, switch to Salesforce to check customer retention data, and email the owner a summary. This cycle repeated daily.
- Managers were switching between 4-6 different tools every day, each with its own login, interface, and data format.
- Invoice data entry was entirely manual. A single vendor invoice with 30 line items took 15-20 minutes to enter into the accounting spreadsheet.
- There was no way to see sales and expenses side by side. Revenue looked great until you factored in purchase costs that lived in a different system.
- Multi-location owners had to repeat the entire process for each location, multiplying the inefficiency.
The Multi-Location Owner
Decision maker. Owns 3-10 restaurant or bar locations. Wants a bird's-eye view of all locations in one glance. Makes capital allocation and staffing decisions based on comparative performance data. Checks the dashboard 2-3 times per day, each session under 5 minutes.
- Wants comparative performance across all locations
- Needs to see sales vs. expenses at a glance
- Expects alerts when an integration fails or data is stale
- Cares about cost trends, not individual invoices
The Operations Manager
Configures integrations, manages invoices, reviews detailed reports. Comfortable with data tools but has no engineering background. Currently spends 2+ hours daily on manual data entry and reconciliation that could be automated.
- Needs to set up and troubleshoot POS integrations
- Wants OCR to handle invoice entry automatically
- Needs detailed order-level data (items sold, payment type, employee)
- Uses export features to share reports with the owner and accountant
Why Neo-Memphis for a B2B Dashboard
Hospitality software looks the same everywhere. Dense tables, grey sidebars, small text, enterprise-grade dullness. The operators I shadowed had four of these open at once. They blurred together. Nobody could tell at a glance which tool they were looking at.
I chose a neo-memphis visual direction for a specific reason: recognition speed. When you open a tab and see rounded geometric shapes, a warm cream background, and purple accents instead of another grey-on-white grid, your brain registers "this is my operations dashboard" in under a second. That matters when you're switching between six tools during a lunch rush.
Approachable, Not Childish
Neo-memphis uses geometric shapes, bold color blocking, and playful composition, but the execution stays restrained. The purple accent is used for interactive elements and active states only. The card radiuses are generous (creating visual warmth) but consistent. No gradients, no drop shadows on data. The playfulness lives in the layout and illustration, not in the data presentation.
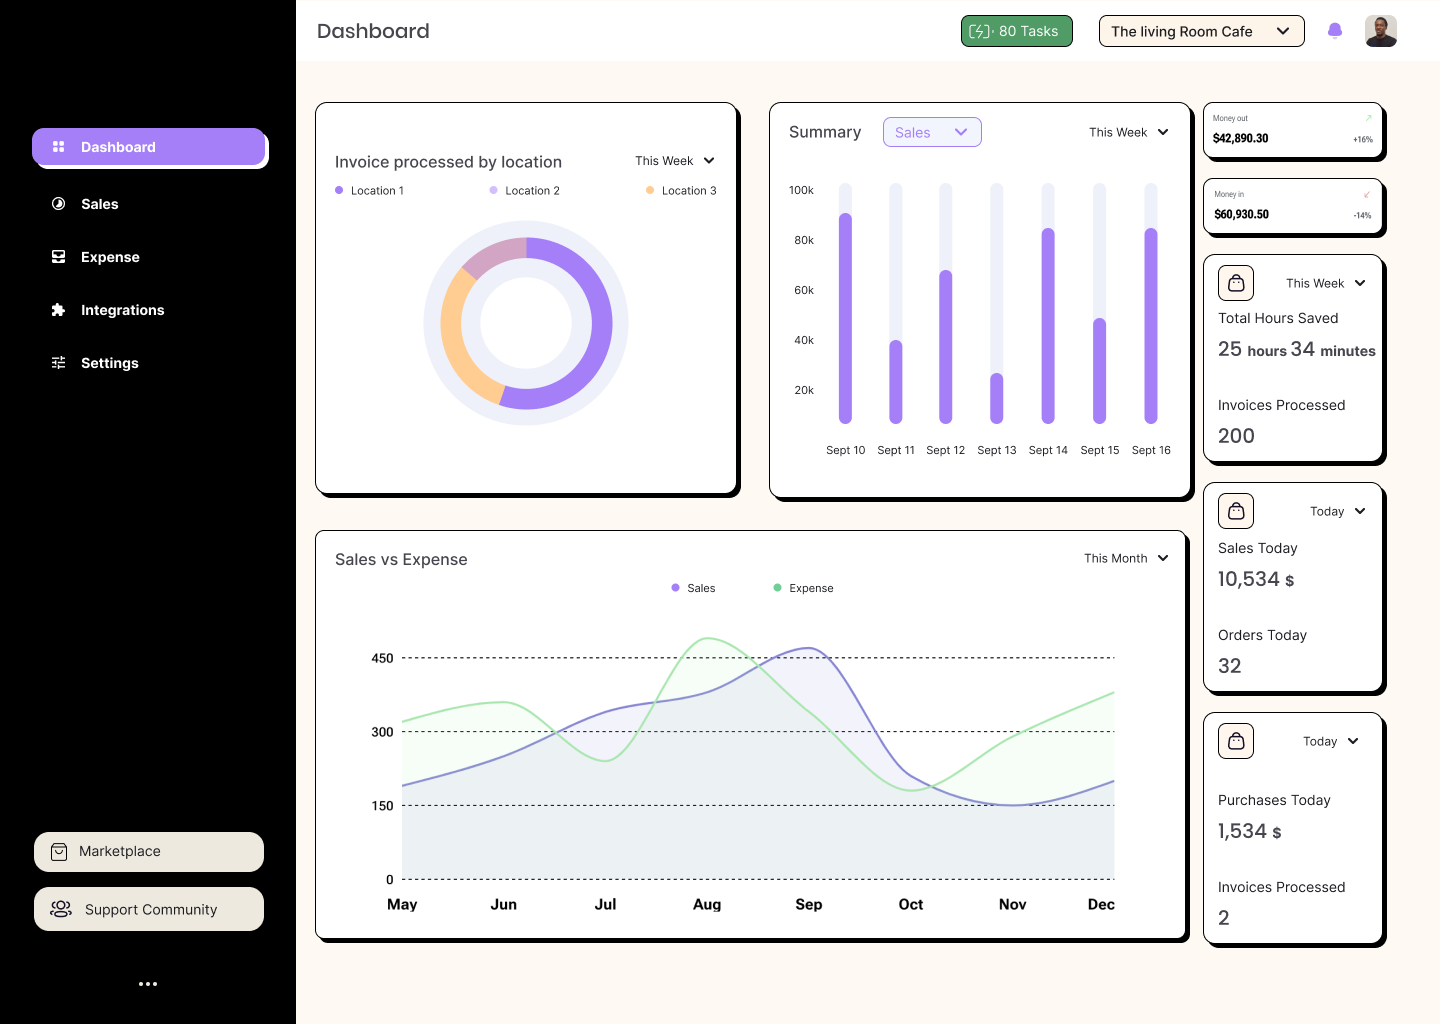
Data Clarity Over Decoration
The warm cream background and rounded cards create visual hierarchy through whitespace, not borders. Charts use a limited palette (purple, green, orange) that maps to consistent meanings: purple for revenue data, green for expense comparisons, orange for location segmentation. Every decorative decision has a functional justification. The donut chart isn't round because it's trendy. It's round because location proportions read faster as segments than as stacked bars.
Color Palette
Five core colors. Each one earns its place by mapping to a specific function in the interface.
Every swatch has a job. Cream replaces pure white to reduce eye strain during all-day use. Purple marks anything clickable: active sidebar items, primary buttons, selected dropdown states, chart highlights. Dark plum anchors the sidebar and creates spatial separation. Green is reserved for positive actions (approve invoice, successful sync). Peach is the neo-memphis signature: it fills illustrations, decorative shapes, and secondary card elements, injecting warmth without competing with data.
Component System
Buttons, cards, and controls all share the neo-memphis DNA: bold outlines, generous radius, high-contrast fills.
 Status Badges & Navigation


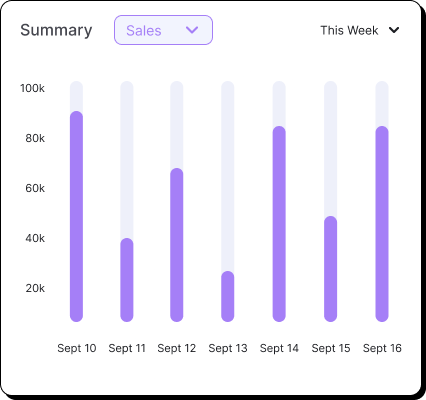
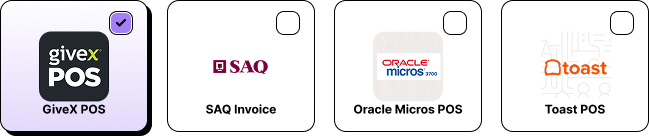
The task badge uses color semantics: green when tasks are pending, red at zero -- providing at-a-glance status. Integration cards use a checkbox-style selection with a purple check mark on the active card. The sidebar uses purple fills for the active state while inactive items stay muted with outlined icons. Chart bars use a purple gradient with rounded tops, reinforcing the soft geometry of the neo-memphis language even in data visualization. Every component shares the same generous border-radius and consistent spacing rhythm.
Illustration Language
Custom spot illustrations use the same palette and outline weight as UI components, so they feel native rather than decorative.


Spot illustrations use a consistent recipe: peach (#FFCC91) fills for warmth, purple (#A57FF7) fills for emphasis, 0.5px black outlines for structure, and green (#519C66) for organic/positive elements. They appear on onboarding screens, empty states, and the business splash screens. The isometric chart illustration anchors the visual identity, while the hourglass and character illustrations bring personality to loading states and first-run experiences.
Typography pairs a geometric sans-serif for headings with a humanist body font. The heading weight is bold enough to anchor dashboard cards at a glance, while the body text stays light enough to not compete with numerical data. Numbers in stat cards use a heavier weight and larger size than their labels, because in a dashboard, the number is always more important than its description.
A Unified Platform for Hospitality Operations
Working with the engineering team, I designed a three-layer architecture. The top layer is what operators see: a dashboard, sales analytics, expense tracking, an integration hub, and a marketplace. The middle layer handles the heavy lifting: OCR processing, data sync pipelines, POS connectors, invoice processors, and access control. The bottom layer connects to external data sources: POS APIs, vendor invoice feeds, and CRM systems. Each layer is independent, so adding a new POS integration or invoice vendor doesn't require redesigning the dashboard.
Integration Wizard: From Zero to Connected
The integration wizard is the centrepiece of the platform. It replaces the old process of emailing API credentials back and forth, waiting for a developer to configure a connection, and hoping the data format matches. Now an operations manager can connect a new POS system or invoice vendor in under two minutes, without writing a single line of code.
The wizard walks users through location selection, data source configuration, integration setup, and billing. Each step validates before allowing the user to proceed, so misconfigurations are caught before they cause sync failures.
Three Integration Categories
Toast, GiveX, Oracle Micros
Pulls real-time sales data, order details, payment types, employee info, and table/section data directly from POS systems.
Status tracking: Active, Pending, Error
SAQ, Breakthru Beverages
Automatically collects invoices from vendor portals, processes them through OCR, and maps line items to expense categories.
Fields: Invoice No, Date, Items, Tax, Total
Salesforce, Google Sheets, Excel
Syncs customer data, exports reports, and enables two-way data flow with existing business intelligence tools.
Schedule: Real-time, Hourly, Daily
OCR Processing: Turning Paper Invoices into Structured Data
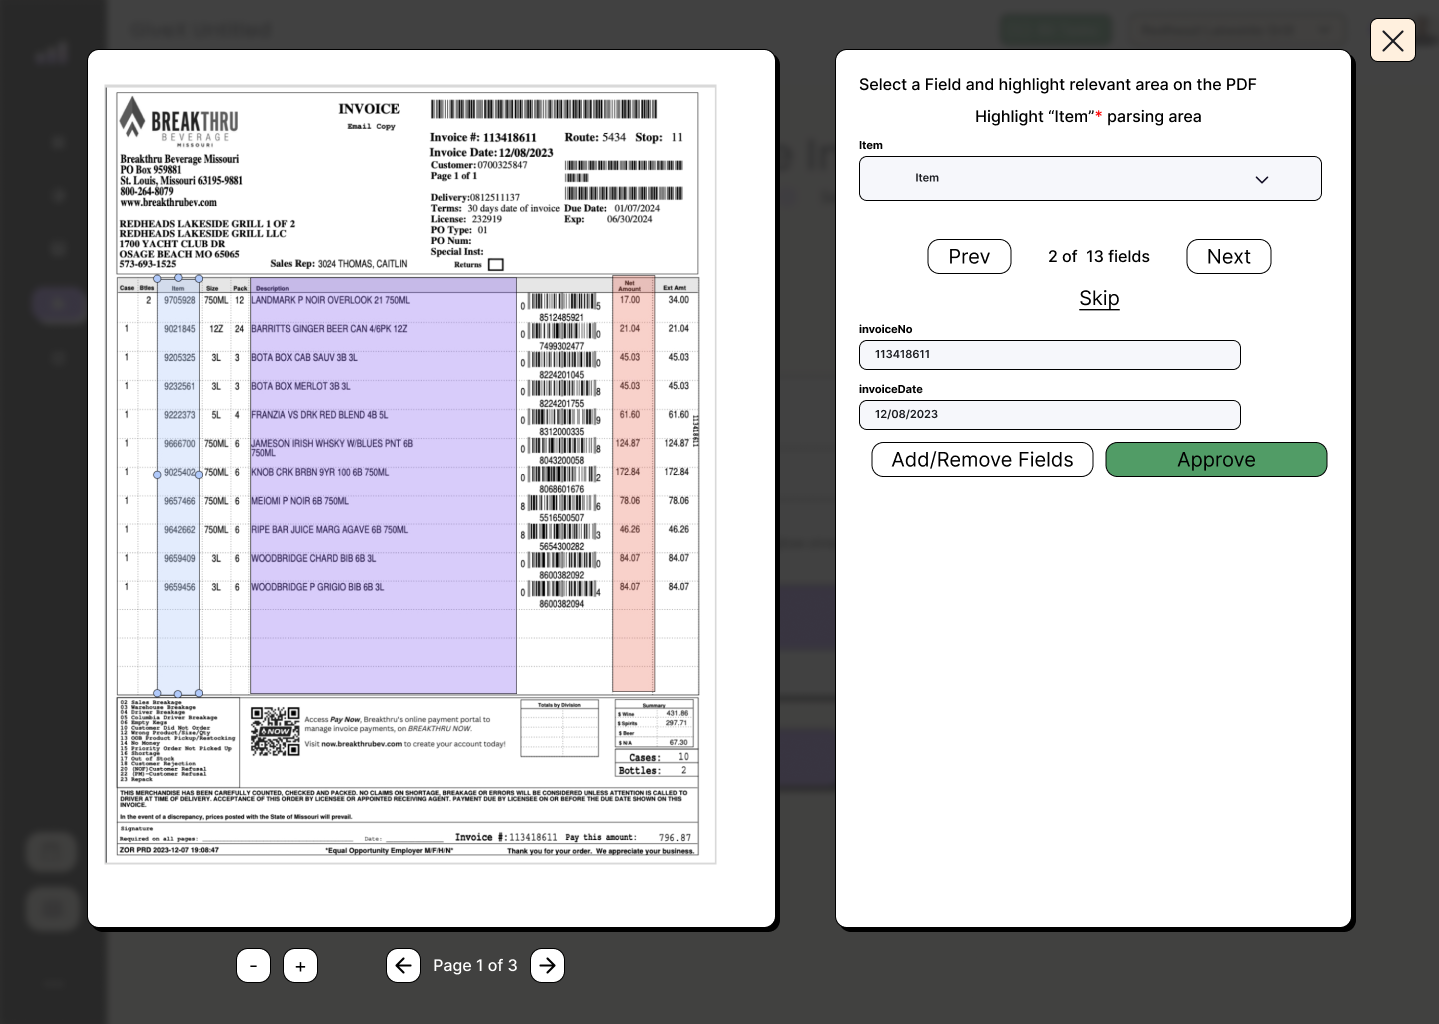
Invoice processing was the single most time-consuming task for operations managers. A distributor like Breakthru Beverage Missouri sends multi-page PDF invoices with dozens of line items - cases of Landmark P Noir, Barritts Ginger Beer, Bota Box, Jameson Irish Whisky, Knob Creek Bourbon, each with case counts, bottle sizes, pack quantities, item numbers, and extended pricing. Before the platform, someone had to open each PDF and manually type every field into a spreadsheet. One invoice took 15-20 minutes. Multiply that by 10-15 invoices per week, per location.
The OCR engine changes this entirely. The operator uploads a PDF and the system presents a split-screen view: the original invoice on the left with colored highlighting over detected fields, and a structured extraction panel on the right. The panel walks through all 13 fields one at a time (invoiceNo, invoiceDate, vendor, itemNo, quantity, unitPrice, and more), letting the operator verify each parsed value before hitting Approve. The whole process takes under a minute per invoice.
| Output Field | Type | Purpose |
|---|---|---|
| Invoice Number | String | Unique identifier for tracking and reconciliation |
| Invoice Date | Date | When the invoice was issued by the vendor |
| Vendor | String | Supplier name (SAQ, Breakthru, etc.) |
| Item Name + Size | String | Product description with unit size (e.g., 750ml) |
| Quantity | Number | Units ordered in this line item |
| Unit Price | Currency | Price per unit before discounts |
| Discount | Currency | Any volume or promotional discount applied |
| Tax | Currency | Applicable tax amount per line item |
| Line Total | Currency | Final amount after discount and tax |
One Account, Many Locations
A single-location bar owner and a ten-location restaurant group have fundamentally different needs, but they both need to start somewhere simple. The multi-location system was designed to grow with the business.
Each location gets its own configuration: which POS system it uses, which vendors supply it, what billing plan it's on, and who has access. The "Add Location" flow captures business details, assigns a billing plan, and requires TOS agreement before activation. This means a restaurant group can have Location A on Toast POS with the Pro plan, while Location B runs GiveX on the Starter plan.
From the owner's perspective, all locations appear in a single sidebar. Clicking a location name filters the entire dashboard, sales data, expense data, and integration status to that specific location. A "View All" option shows aggregated data across the portfolio.
The Right Data for the Right Role
Hospitality businesses have complex team structures. The owner needs to see everything. The general manager needs to configure integrations but shouldn't change billing. A consultant brought in for a quarterly review needs read-only access to analytics. The bar manager at Location B should only see Location B's data.
I designed a six-tier role hierarchy that maps directly to how hospitality businesses actually operate:
| Role | Scope | Key Permissions |
|---|---|---|
| Super Admin | Platform-wide | Full system access, user management, billing, all locations |
| Business Owner | All owned locations | View all data, manage users, configure integrations, billing |
| Admin | Assigned locations | Configure integrations, manage invoices, export reports |
| Consultant | Assigned locations | Read-only access to analytics and reports |
| Viewer | Assigned locations | View dashboard and sales data only |
| Location Manager | Single location | Full access to one location's data and settings |
Users are invited by email with a specific role assignment. The invitation flow lets the inviter select which locations the new user should have access to, preventing accidental over-provisioning of permissions.
Browse, Compare, Connect, Configure
The marketplace is where operators discover new integrations. Instead of a flat list of connectors, I designed a categorized browsing experience. Each data source has a card showing its name, supported data types (expense, sales, or both), a brief description, and a "Connect" action. Operators can filter by category (POS, Invoice, CRM, Analytics) and see which integrations are already active for their account. The settings panel lives alongside the marketplace, giving operators a single place to manage their business profile, billing details, payment methods, task history, and configuration preferences.
Available data sources at launch included:
- Sculpture Hospitality - expense and sales data for inventory management
- Toast POS - full POS integration with order-level detail
- GiveX POS - POS and loyalty program data
- Breakthru Beverages - beverage distributor invoice automation
- SAQ - Quebec liquor board invoice processing
- Salesforce Retail CRM - customer relationship data
- Google Sheets / Microsoft Excel - spreadsheet import and export
Keeping Everything in Sync
Data sync is the backbone that makes everything else work. Two different sync strategies run in parallel, each optimized for its data source type:
Real-time sync handles POS data. When a server closes a check on Toast, that order appears in the platform dashboard within seconds. The POS connector maintains a persistent connection to each POS system's API, subscribing to order events and transforming the data into the platform's normalized schema on the fly.
Scheduled sync handles invoice data. Vendor portals like SAQ and Breakthru don't offer real-time feeds. Instead, the pipeline runs on a configurable schedule (hourly, daily, or on-demand), pulling new invoices, running them through OCR, and staging them for operator review.
Both paths converge in the same data pipeline: incoming data is validated, transformed to match the platform schema, deduplicated against existing records, and loaded into PostgreSQL. Every sync operation is logged with status (success, partial, or failed), duration, and record count, which feeds into the integration logs viewer that operators use to troubleshoot issues.
Active (syncing normally), Billing Pending (payment required), TOS Pending (terms of service not yet accepted), or Error (sync failures detected). The status appears as a colored badge in the integration hub, and operators receive notifications when a status changes.
What I Found
New integration setup dropped from hours to under 2 minutes
Before the wizard, connecting a new POS system involved emailing API credentials, waiting for a developer to configure the connection, and testing manually. The wizard with inline validation reduced this to a self-service flow that most operators completed in 90 seconds.
OCR reduced manual invoice entry by approximately 80%
For standard invoice formats from major vendors (SAQ, Breakthru), the OCR engine achieves 95%+ field extraction accuracy. Operators now review and approve instead of typing. What took 15-20 minutes per invoice now takes under a minute.
Daily tool-switching dropped from 6 tools to 1
Operators who previously toggled between POS dashboards, vendor portals, spreadsheets, CRMs, email, and accounting software now start and end their day in the platform. The unified dashboard became their single starting point for all operations decisions.
Non-standard invoice formats still require significant manual correction
The OCR engine performs well on structured invoices from major vendors with consistent layouts. But smaller vendors with handwritten notes, unusual formatting, or scanned copies at odd angles produce extraction accuracy closer to 60-70%. These invoices still require substantial manual review, partially negating the time savings.
Some POS systems have limited API capabilities that constrain data richness
Not all POS systems expose the same level of detail through their APIs. Toast provides granular order-level data including employee, section, and table information. GiveX exposes less detail. Oracle Micros requires a separate middleware layer. This means the depth of analytics varies by POS system, which confuses operators who expect consistent data across all their locations.
Key Iterations
Switched from a flat integration list to a categorized marketplace
The original design showed all available integrations in a single scrollable list. Usability testing revealed that operators couldn't quickly find what they needed. Reorganizing into categories (POS, Invoice, CRM, Analytics) with filtering cut search time by more than half.
Replaced single-page setup with a multi-step wizard
The first integration setup was a single long form with all fields visible at once. Users got overwhelmed, skipped required fields, and submitted incomplete configurations. Breaking it into six focused steps with validation at each stage eliminated configuration errors almost entirely.
Added location-specific billing after enterprise client feedback
The initial billing model was one plan per account. Enterprise clients with 5+ locations needed different tiers for different locations (a high-volume flagship on Pro, a small satellite on Starter). Redesigned billing to be location-scoped, which added complexity but matched how these businesses actually budget.
Introduced integration log viewer after support ticket patterns
Support kept receiving "my data isn't updating" tickets. Without a log viewer, troubleshooting meant engineers checking server logs. Adding a user-facing log viewer with sync status, timestamps, and error messages cut these support tickets by roughly 60% because operators could self-diagnose common issues like expired API tokens or rate limits.
What I'd Do Differently
OCR accuracy was solved by continuously updating the recognition dictionary. Early on, the OCR review interface assumed 90%+ accuracy across all vendors. Non-standard invoices initially hit 60-70% accuracy, but instead of redesigning the UI, we built a continuously updating recognition dictionary that learns from operator corrections. Each time an operator fixes a misread field, the correction feeds back into the dictionary for that vendor's template. Over time, accuracy improved to 95%+ even for irregular formats, and the original "quick review and approve" flow worked as intended.
Billing complexity was significantly underestimated. What seemed like a simple pricing page (Starter $11/mo, Advanced $35/mo, Pro $69/mo) became deeply complex when each location could be on a different plan, each plan has overage charges ($0.20-$0.40 per extra task), and enterprise clients needed consolidated invoicing across locations. The billing module took nearly as much design effort as the integration wizard itself.
The role system needed more user research upfront. The six-tier role hierarchy was based on how we assumed hospitality businesses operate. In practice, some businesses wanted custom role combinations (a "Location Manager" who can also configure integrations for their location, but not others). A more flexible permissions model would have avoided several rounds of iteration.
Next Steps
- Mobile companion app for on-the-go access to dashboard summaries, push notifications for integration failures, and quick invoice approval.
- Webhook notifications for real-time alerts when sync failures occur, invoices arrive, or sales targets are hit.
- Advanced analytics dashboards with trend analysis, location comparisons, and predictive insights for purchasing decisions.
- API for third-party developers to build custom integrations and extend the platform beyond the built-in marketplace.
This case study documents my design and research work on a SaaS platform that unifies POS, invoice, and inventory systems for hospitality businesses. The platform is in active use by restaurant and bar operators across multiple locations, handling daily sales sync, automated invoice processing, and integration management. I worked with a team of three engineers and one product manager over two months.
Stack: React, Node.js, PostgreSQL, AWS, OCR Engine, REST APIs.
Integrations: Toast POS, GiveX POS, Oracle Micros, SAQ, Breakthru Beverages, Salesforce CRM.
All screenshots are from the production application. Sensitive business data has been anonymized.
