Bars lose significant revenue through liquor wastage - not solely due to theft, but because existing inventory systems fail to measure reality as it happens. STEWARD explores how passive measurement, behavioral empathy and system-level design can transform liquor inventory from a manual, reactive process into a sustainable, data-driven one - without disrupting service or trust.
Design Process
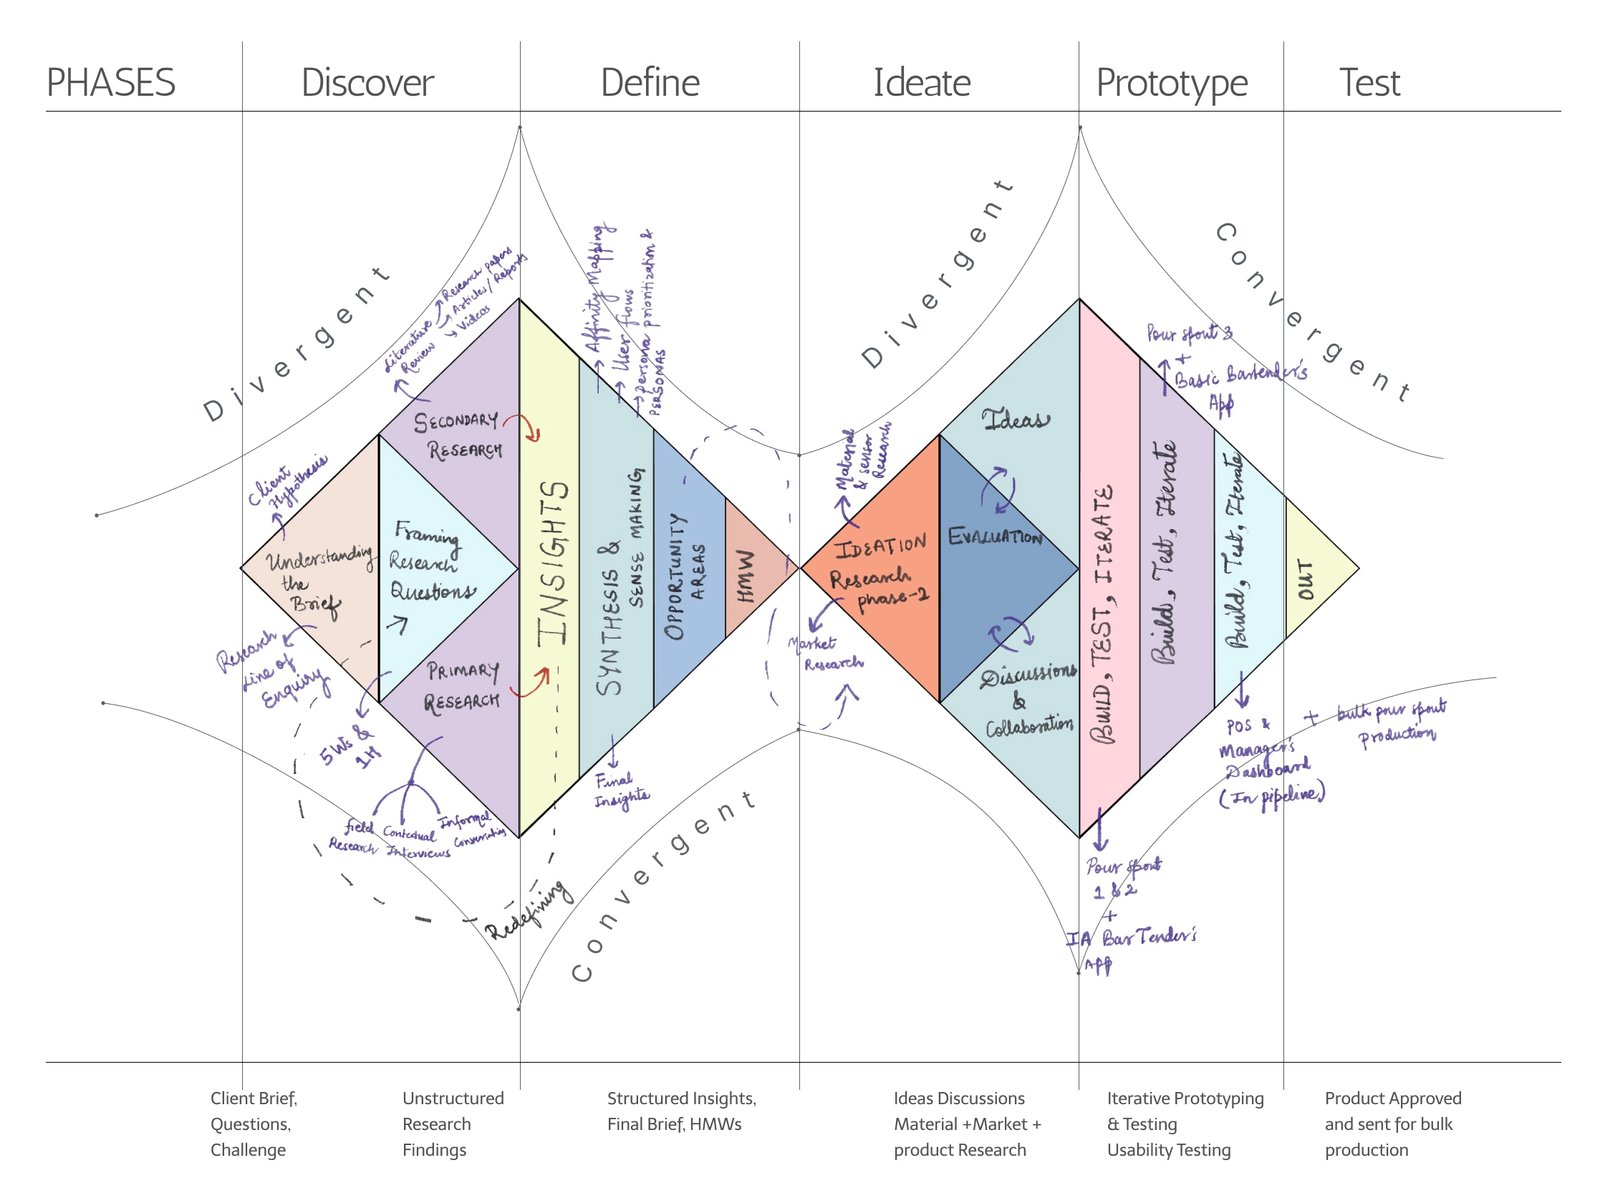
Double Diamond - Iterative Process
Discover

A client approached us after observing persistent liquor wastage and unexplained inventory shrinkage across shifts. While theft was suspected, there was no concrete evidence to validate or disprove it. Existing inventory records were manual, retrospective and inconsistent, making it impossible to distinguish between intentional misuse, unintentional overpouring, or systemic inefficiencies.
Rather than asking for a predefined solution, the client proposed a research study to understand why liquor loss was occurring and whether an intervention could meaningfully reduce wastage without disrupting bar operations. Also the client assumed if we find a feasible solution, it could become a good business opportunity.
INITIAL HYPOTHESIS (Client Perspective)
Liquor wastage was higher than acceptable margins
Some loss could be attributed to theft or misuse
Better visibility into pouring behavior might reduce shrinkage
However, the mechanism, scale and root causes of the problem were unknown...
Research Problem Statement / Line of Enquiry
Bars and pubs experience alcohol loss, but lack clarity on when, where and why this loss occurs. This research aims to understand existing alcohol handling practices, record-keeping behaviors and breakdown points across people, processes and environments.
What did I understand from this ?
Alcohol handling and accountability in bar and pub environments
Lack of visibility and traceability in alcohol usage
Operational and financial impact of unaccounted alcohol
Framing the 5Ws & 1H Questions
SECONDARY RESEARCH & LITERATURE REVIEW
Goals
- Understand industry standards and constraints
- Identify existing solutions and their failure points
- Quantify the impact of liquor wastage
These questions guided the Research Direction
.png)
Research Activities
- Reviewed bar inventory management workflows and POS systems
- Studied industry reports, research papers, blogs, videos and articles on bar inventory management, liquor loss and overpouring
- Analyzed existing hardware and software-based monitoring tools
Key Findings
Inventory shrinkage in bars is both widespread and financially significant. Industry estimates place typical liquor shrinkage at approximately 15-25% due to overpouring, spills and unrecorded losses.
Traditional inventory methods - largely manual and retrospective - do not detect losses in real time, leaving managers without timely insight into overpouring or variance patterns.
Industry analysis consistently identifies overpouring and poor portion control as key drivers of liquor cost variance and shrinkage.
PRIMARY RESEARCH
Disclosure: Some part of the primary research was conducted in Indian (Bangalore) bar contexts due to logistic constraints. This research was validated by the other part of the primary research and entirety of secondary research conducted in US demographic context.
Methods
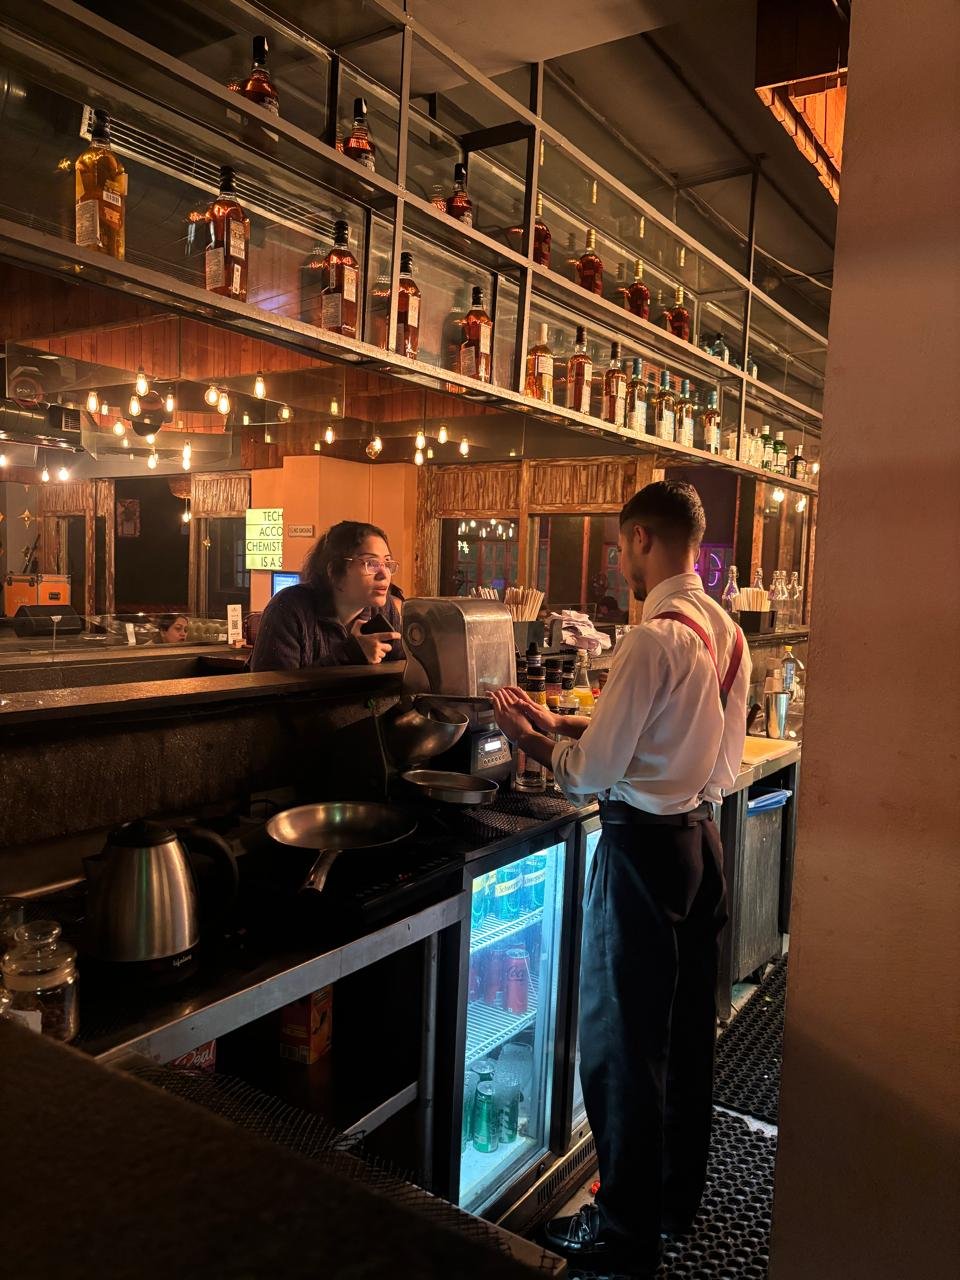
- Ethnographic (covert & overt) research during service hours
- Contextual interviews with bar owners, managers and bartenders
- Informal conversations with bartenders, bar owners, managers, customers and other staff


What I Looked For
- Behavioral patterns under pressure
- Points of friction during inventory tracking
- Workarounds used by staff
- Signs of intentional or unintentional liquor loss
- Emotional responses to monitoring and control
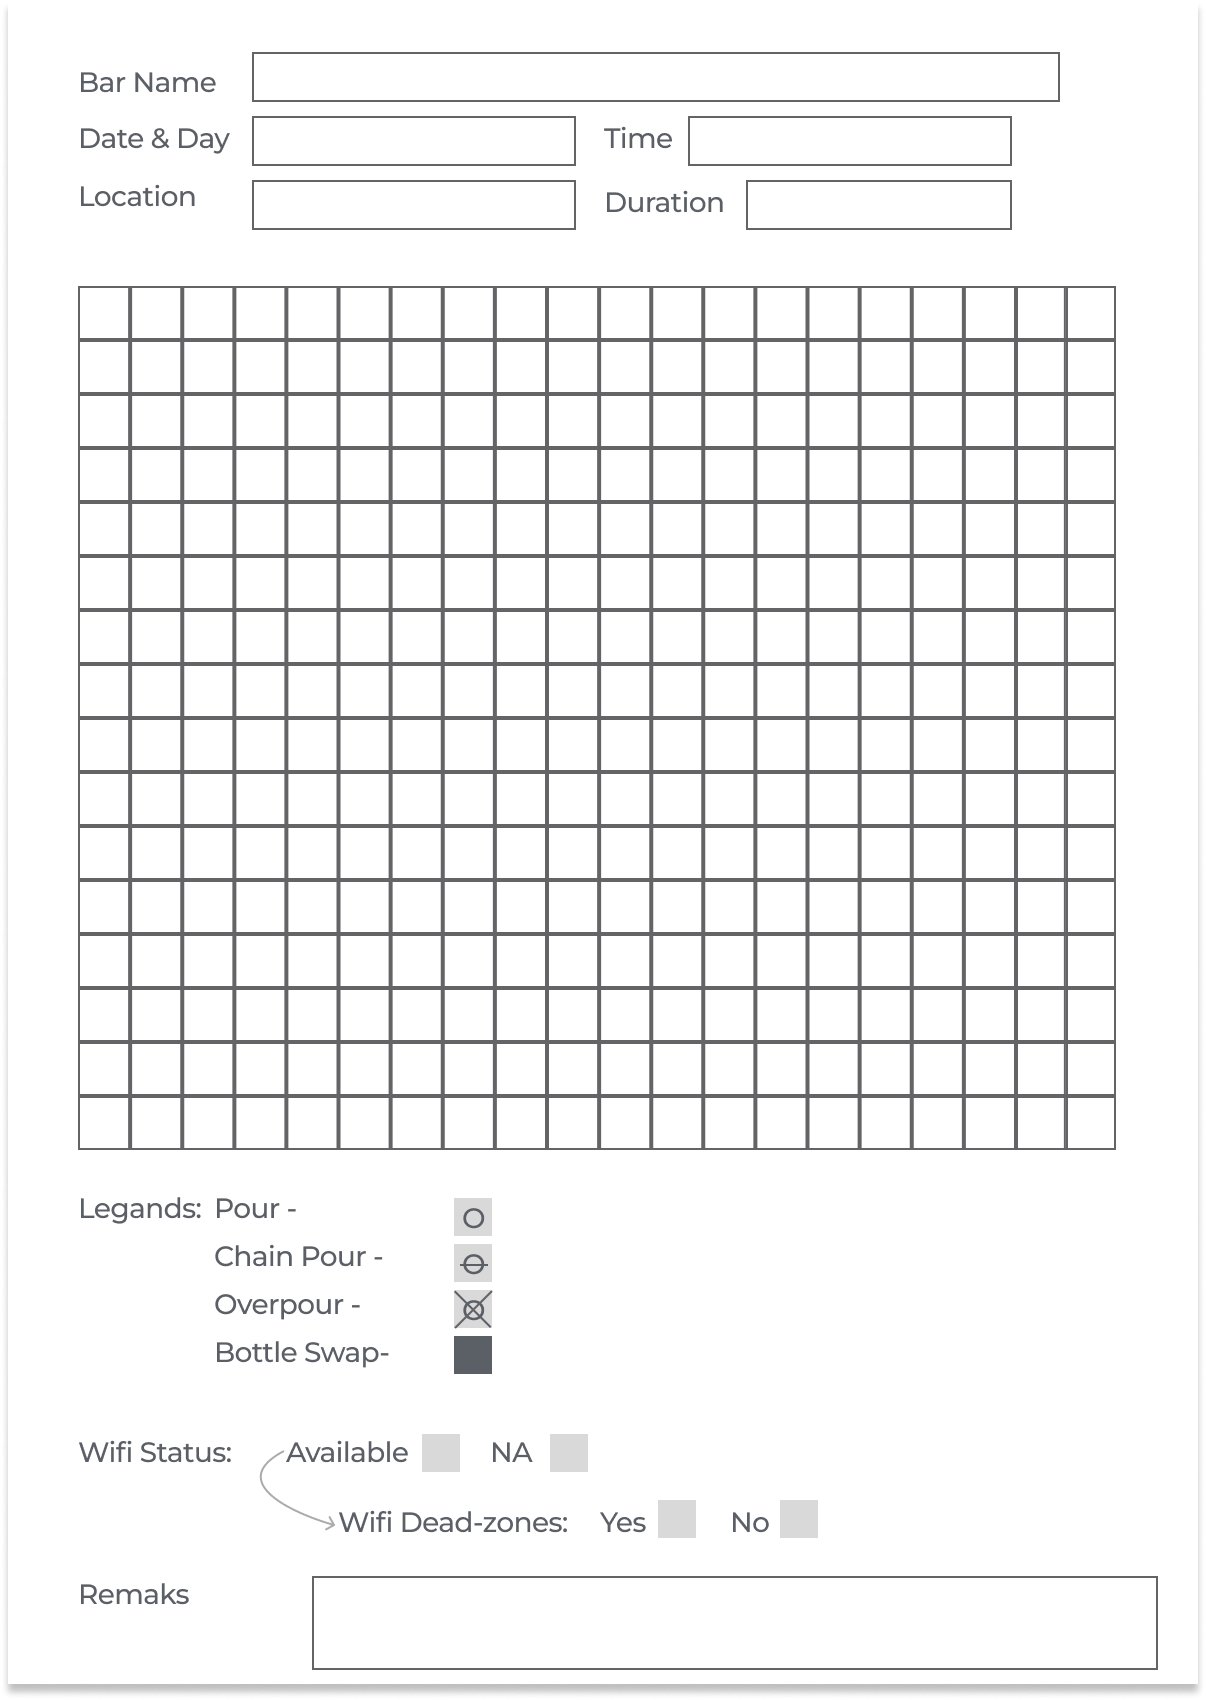
Hybrid Ethnographic Research
Research conducted in Bangalore Bars & Pubs
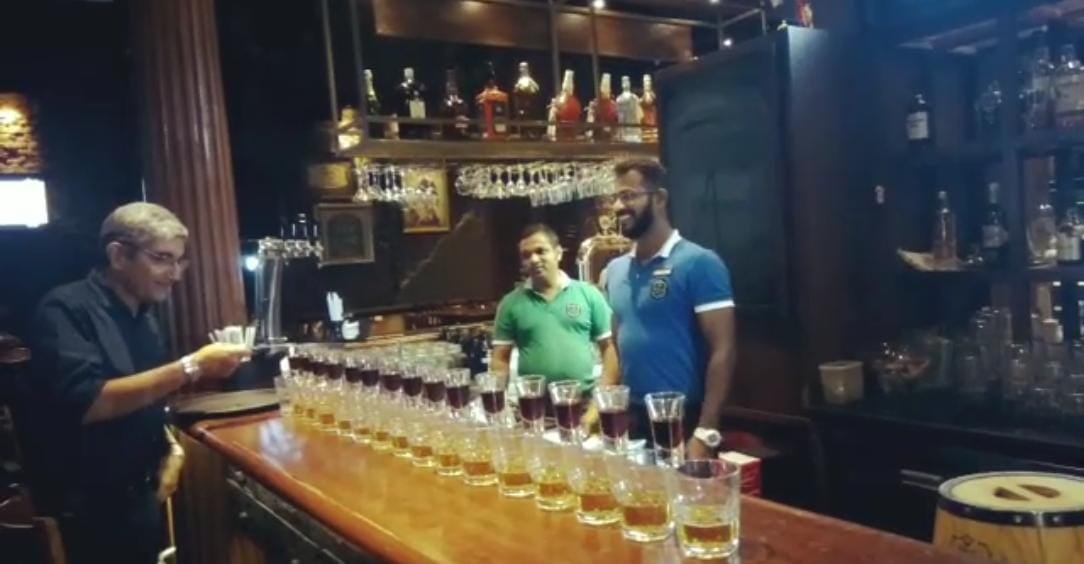
Covert Observation
- Observed bartender pouring behavior without staff awareness
- Documented free-pour durations, chain pouring, and bottle handling
- Noted shift-based behavior changes (calm vs rush hours)
- Identified habitual overpouring patterns across bartenders
Overt Observation
- Observed with staff knowledge; studied workflow disruptions
- Documented inventory handoff processes between shifts
- Noted emotional responses to being monitored
- Identified trust dynamics between staff and management
Contextual Interviews
- Interviewed bar owners, managers and bartenders during shifts
- Explored attitudes toward inventory tracking and accountability
- Documented pain points in current inventory processes
- Captured workarounds and informal communication patterns
Research Environment
Research conducted across multiple bar types:
Research Data Visualizations
Average Single Pour Duration (Tilt Time)
Avg Pours / Bartender / Hour
Chain Pouring Events
42% of all pours observed were chain pours — bartender moved from Glass A to Glass B without returning bottle to upright position.
Overpour Rate
~18% of pours appeared visibly over target (more common with novice staff)
Pour Volume Distribution
Distribution of individual pour volumes. Vertical line marks the average at 78ml, showing wide spread across bartenders.
Key Insights
- Overpouring was often habitual, not malicious
- Speed and muscle memory dominated bartender behavior
- Any system requiring extra steps during service would be ignored
- Managers wanted visibility, not enforcement
- Trust was fragile - surveillance-based solutions risked backlash
Reframing the Problem
Research revealed that theft was a symptom, not the root issue. The deeper problem was the absence of a reliable, sustainable inventory system capable of capturing real-world pouring behavior in real time.
Define
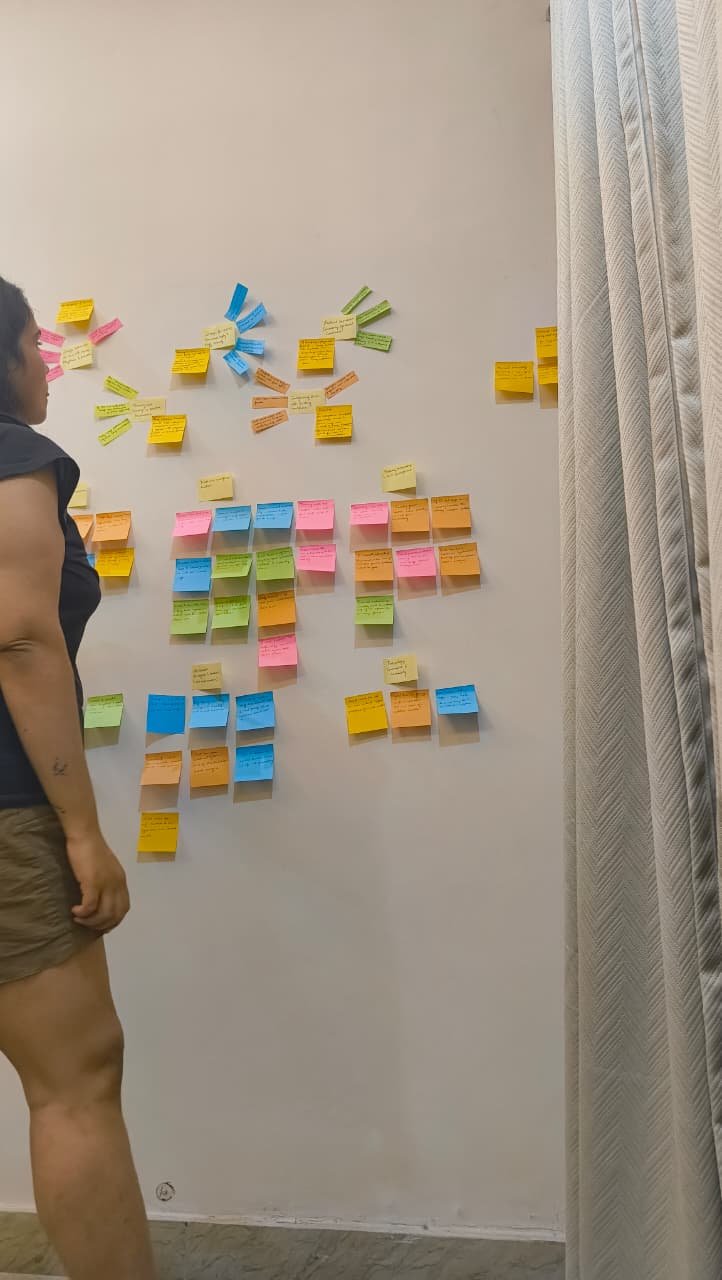
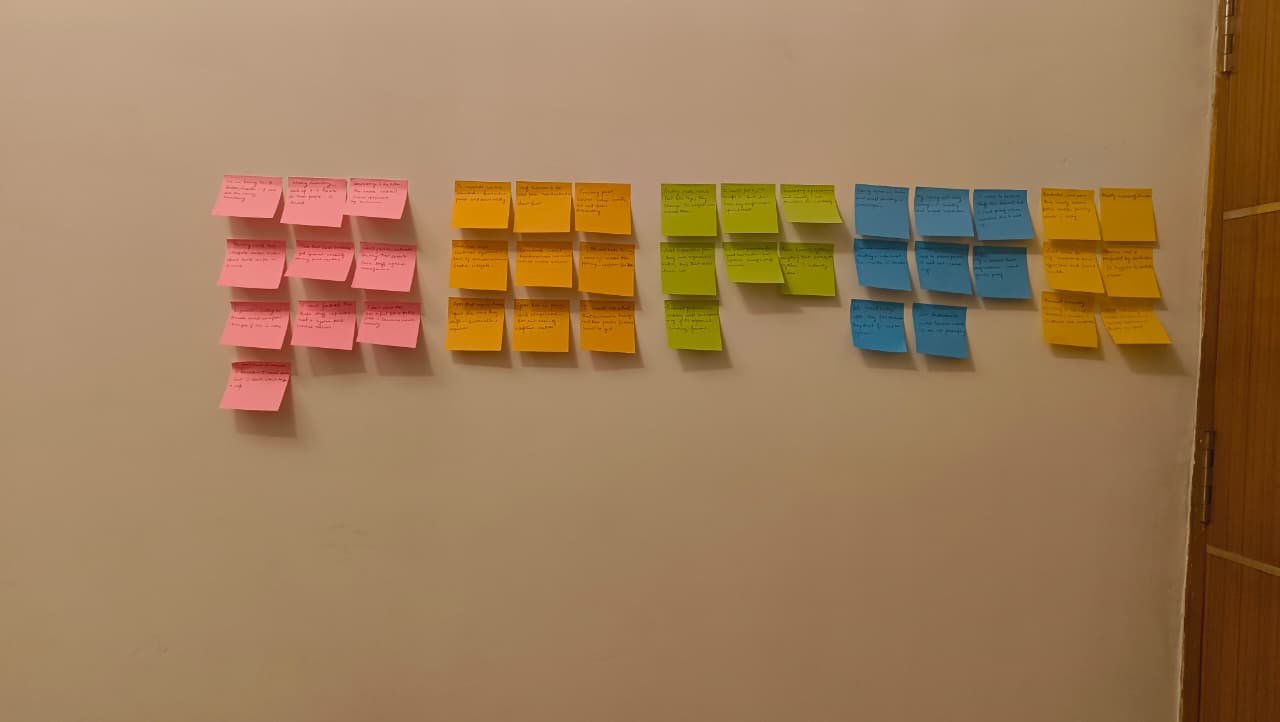
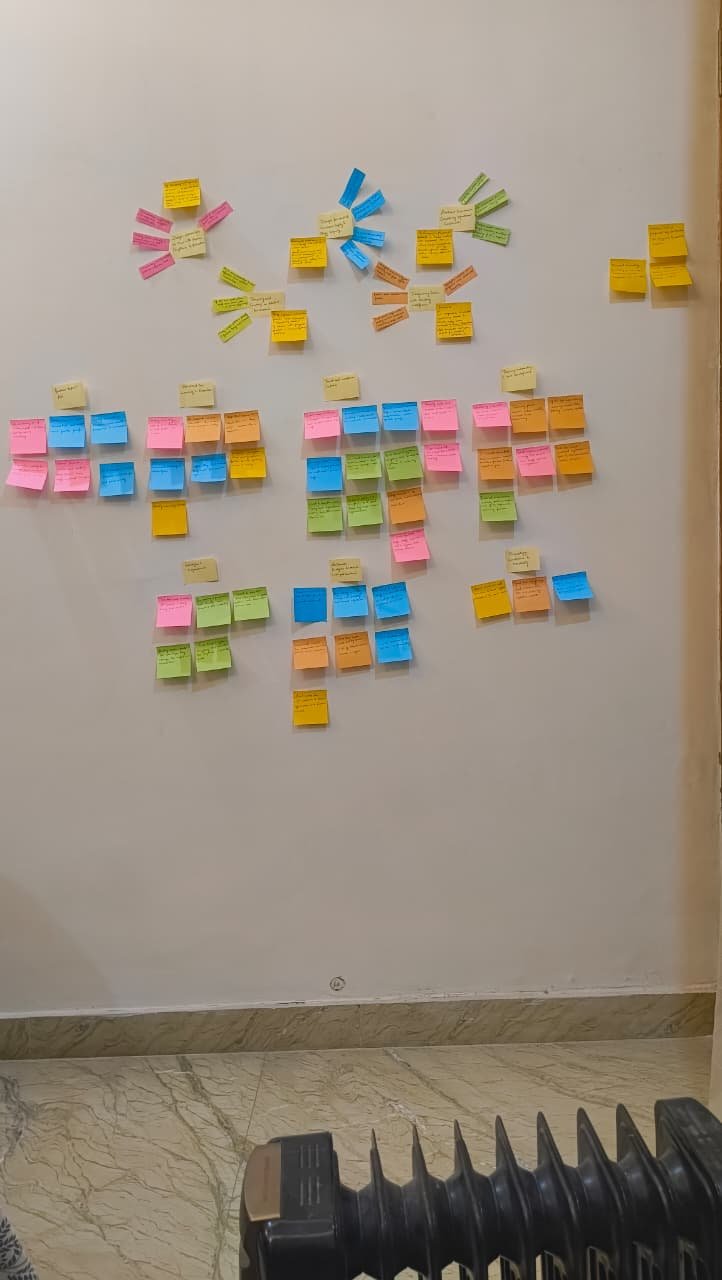
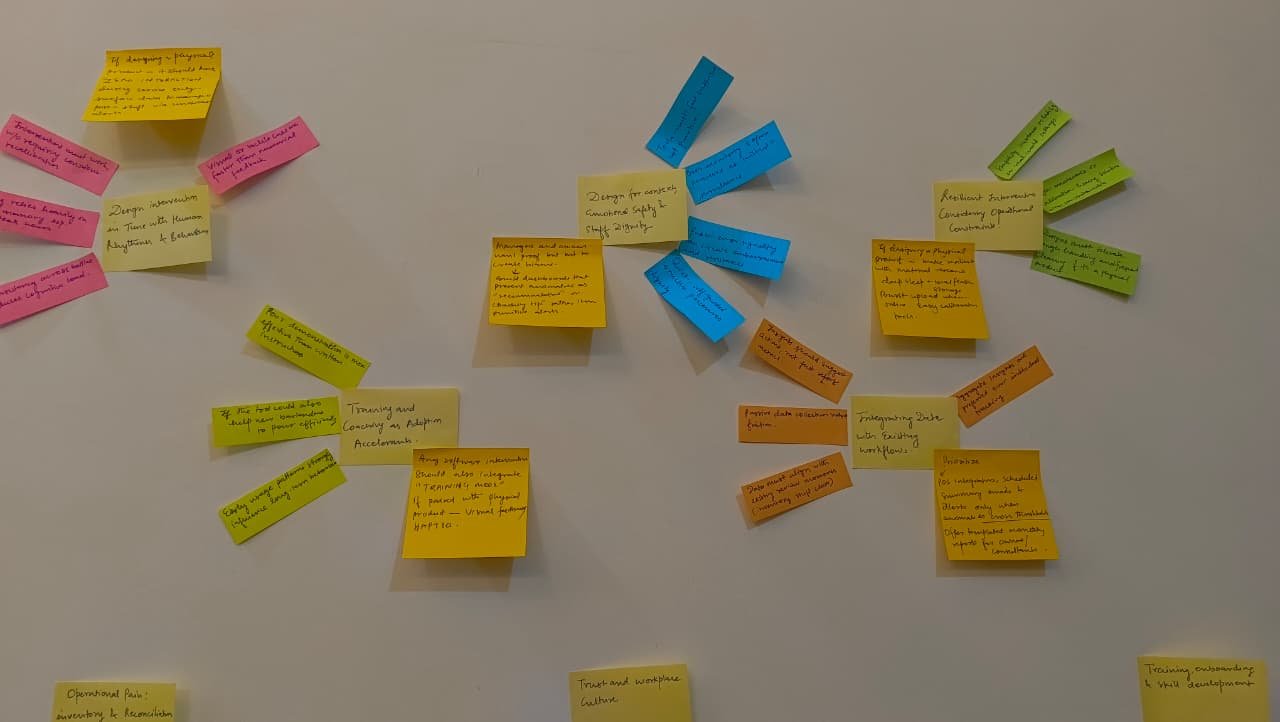
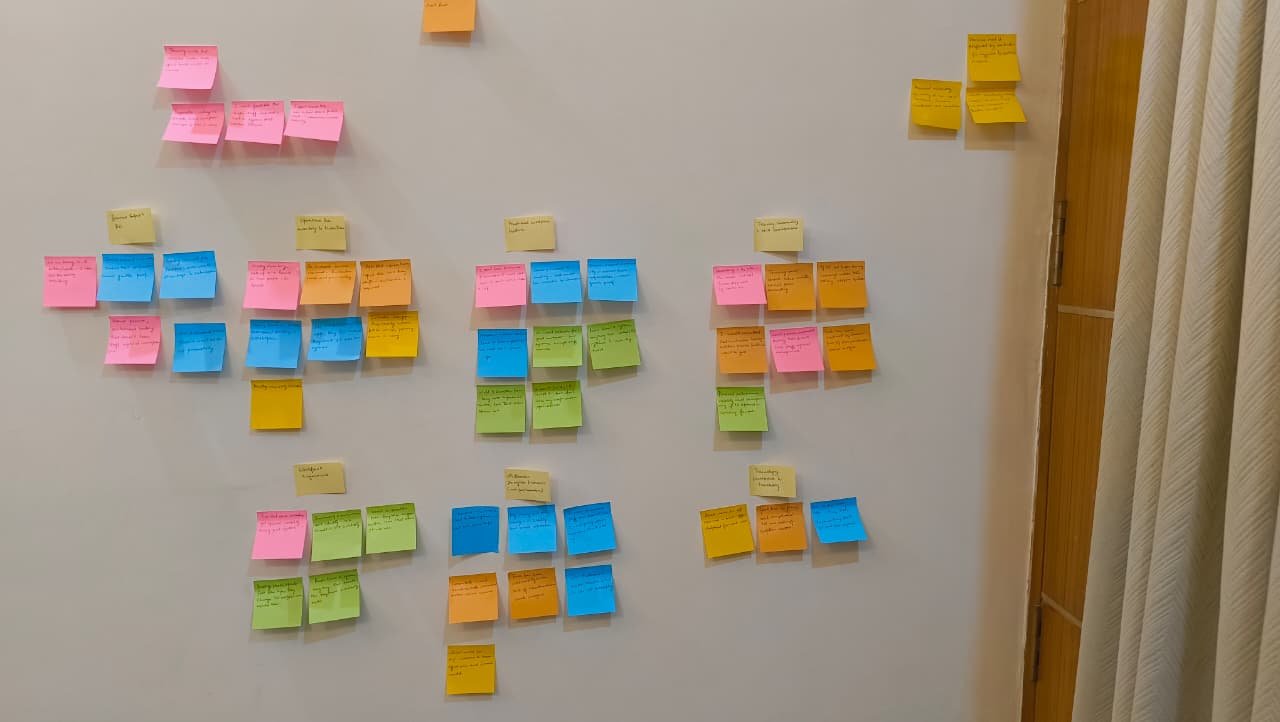
Affinity Mapping
To structure insights, I clustered findings through affinity mapping across 5 lenses:
User Flows
Journey maps capturing the experience of 5 key personas in bar operations
Bar Manager

Age 43
Location New Jersey, USA
Lead Bartender

Age 36
Location Illinois, USA
Newly Appointed Bartender (In Training)
Age 24
Location Illinois, USA
Waiter

Age 27
Location Bangalore, India
Bar Accountant

Age 52
Location New Delhi, India
PERSONA PRIORITIZATION
Primary
Bartender (Lead + Trainee Combined)
Highest daily interaction with system; biggest direct impact on shrinkage, speed and guest experience.

Secondary
Bar Manager
Decision-maker and enforcer; uses insights generated from bartender activity.
Tertiary
Bar Accountant
Periodic user, validates outcomes and compliance rather than driving daily behaviour.
Design Principles
Brainstorming & Ideation
Liquor Monitoring Comparison Table
| Evaluation Criteria | POS-Based Inventory Software | Scale-Based Bottle Weighing | Vision / Photo-Based Scanning | RFID / Tagged Bottles | Surveillance / Camera Systems | Stealth Smart Pour Spout |
|---|---|---|---|---|---|---|
| Measures at point of consumption | ✗ | ✗ | ✗ | △ | △ | ✓ |
| Real-time data capture | ✗ | ✗ | ✗ | △ | △ | ✓ |
| Passive (no staff action required) | ✗ | ✗ | ✗ | △ | ✓ | ✓ |
| Preserves bartender workflow | △ | ✗ | ✗ | ✗ | ✓ | ✓ |
| Low cognitive load during service | △ | △ | ✗ | ✗ | ✓ | ✓ |
| Non-intrusive / trust-preserving | ✓ | ✓ | △ | △ | ✗ | ✓ |
| Accurate per-pour measurement | ✗ | ✗ | ✗ | △ | △ | ✓ |
| Prevents loss (not just reports it) | ✗ | △ | △ | △ | △ | ✓ |
| Scales across bar types & volumes | ✓ | △ | △ | △ | △ | ✓ |
| Operationally feasible in peak hours | ✓ | ✗ | ✗ | ✗ | ✓ | ✓ |
| Supports long-term sustainability goals | △ | △ | △ | △ | △ | ✓ |
Solution Analysis
POS-Integrated Inventory Software (Manual Counts, Scanning, Reconciliation)
- Integrates with existing POS and accounting systems
- Reduces spreadsheet-based errors
- Improves ordering, forecasting, and reporting
- Low hardware overhead
- Relies on periodic, manual input
- Detects variance after loss has already occurred
- Accuracy depends on staff consistency and compliance
- Provides no insight into how or when loss happens
Scale-Based Bottle Weighing Systems
- More accurate than visual estimation
- Quantifies partial bottle usage
- Useful for audits and inventory snapshots
- Hardware-assisted precision
- Requires physically handling and weighing bottles
- Interrupts workflow during busy hours
- Still periodic, not continuous
- Does not capture individual pour events
AI / Vision-Based Mobile Scanning
- Minimal hardware requirements
- Faster than manual counts
- Easy onboarding (smartphone-based)
- Lower upfront cost
- Dependent on lighting, angles and bottle placement
- Still requires active staff participation
- Not real-time, limited to inventory moments
- Accuracy varies with bottle shape and label visibility
RFID & Tagged Bottle Systems
- Automated identification of bottles
- Can track movement across locations
- Strong audit and compliance potential
- High setup and maintenance cost
- Complex infrastructure requirements
- Limited adoption in real bar environments
- Poor compatibility with fast-paced service
Surveillance & Camera-Assisted Monitoring
- High visibility and deterrence
- Useful for incident review
- Works independently of POS
- Raises privacy and trust concerns
- Labor-intensive review process
- No quantitative measurement of pours
- Actively alters staff behavior
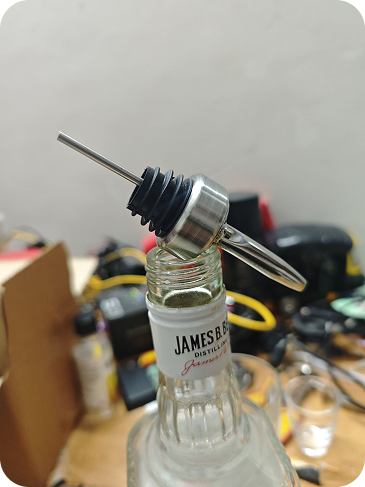
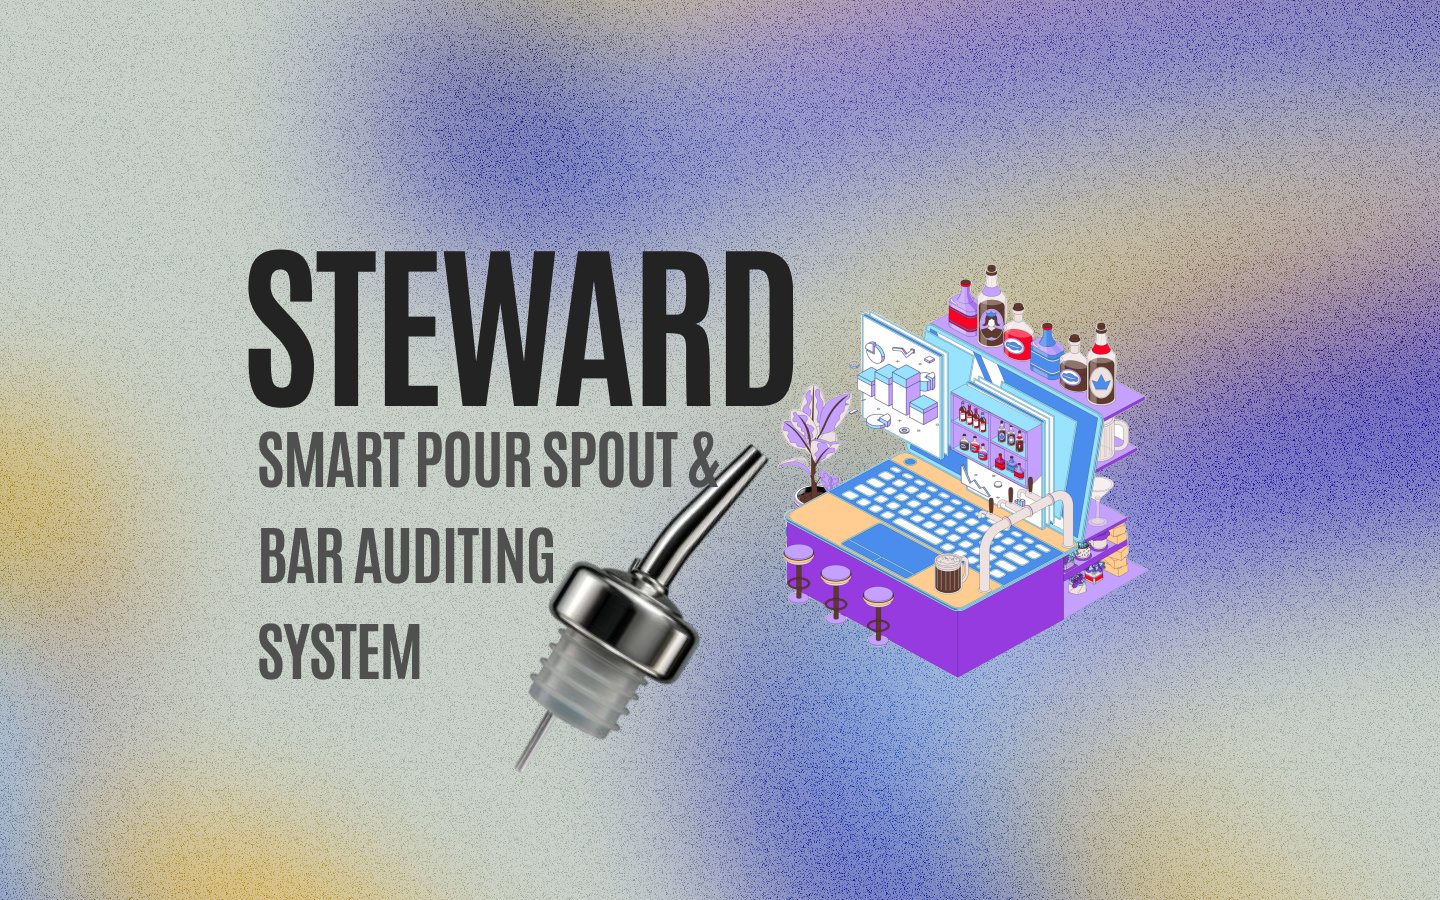
Stealth Smart Pour Spout
- Measures liquor directly at the point of consumption
- Captures real-time, per-pour data
- Operates passively with no bartender action required
- Preserves existing workflows during peak service
- Non-intrusive and trust-preserving (no cameras or surveillance)
- High accuracy independent of bottle shape or lighting
- Enables early detection of overpouring and wastage patterns
- Scales well across different bar sizes and volumes
- Integrates with POS and inventory management systems
- Supports long-term sustainable inventory optimization
- Requires hardware installation and maintenance
- Higher upfront cost compared to software-only solutions
- Does not capture non-pour losses (e.g., spills, breakage)
- Dependent on sensor calibration and hardware reliability
- Initial onboarding and staff buy-in still required
Results